
GBPUSD is positioned between conflicting timeframe signals. The weekly chart still carries a firm downtrend, while the daily chart retains a firm uptrend but has developed a bearish sub-trend. The latest daily close at 1.35491 sits inside the daily broken-retest support zone at 1.35346–1.35580, leaving the next directional move dependent on whether buyers defend this area or sellers force a deeper retracement.
| Metric | Reading |
|---|---|
| Latest weekly close | 1.35167 |
| Latest daily close | 1.35491 |
| Weekly trend | Down, with an upward sub-trend |
| Daily trend | Up, with a downward sub-trend |
| Nearest daily resistance | 1.36441–1.36754 |
| Nearest daily support | 1.35346–1.35580 |
| Relevant Fibonacci level | 0.382 at 1.35217 |
| Daily bias | Conditional range, with a slight bullish preference while support holds |
Higher-timeframe context
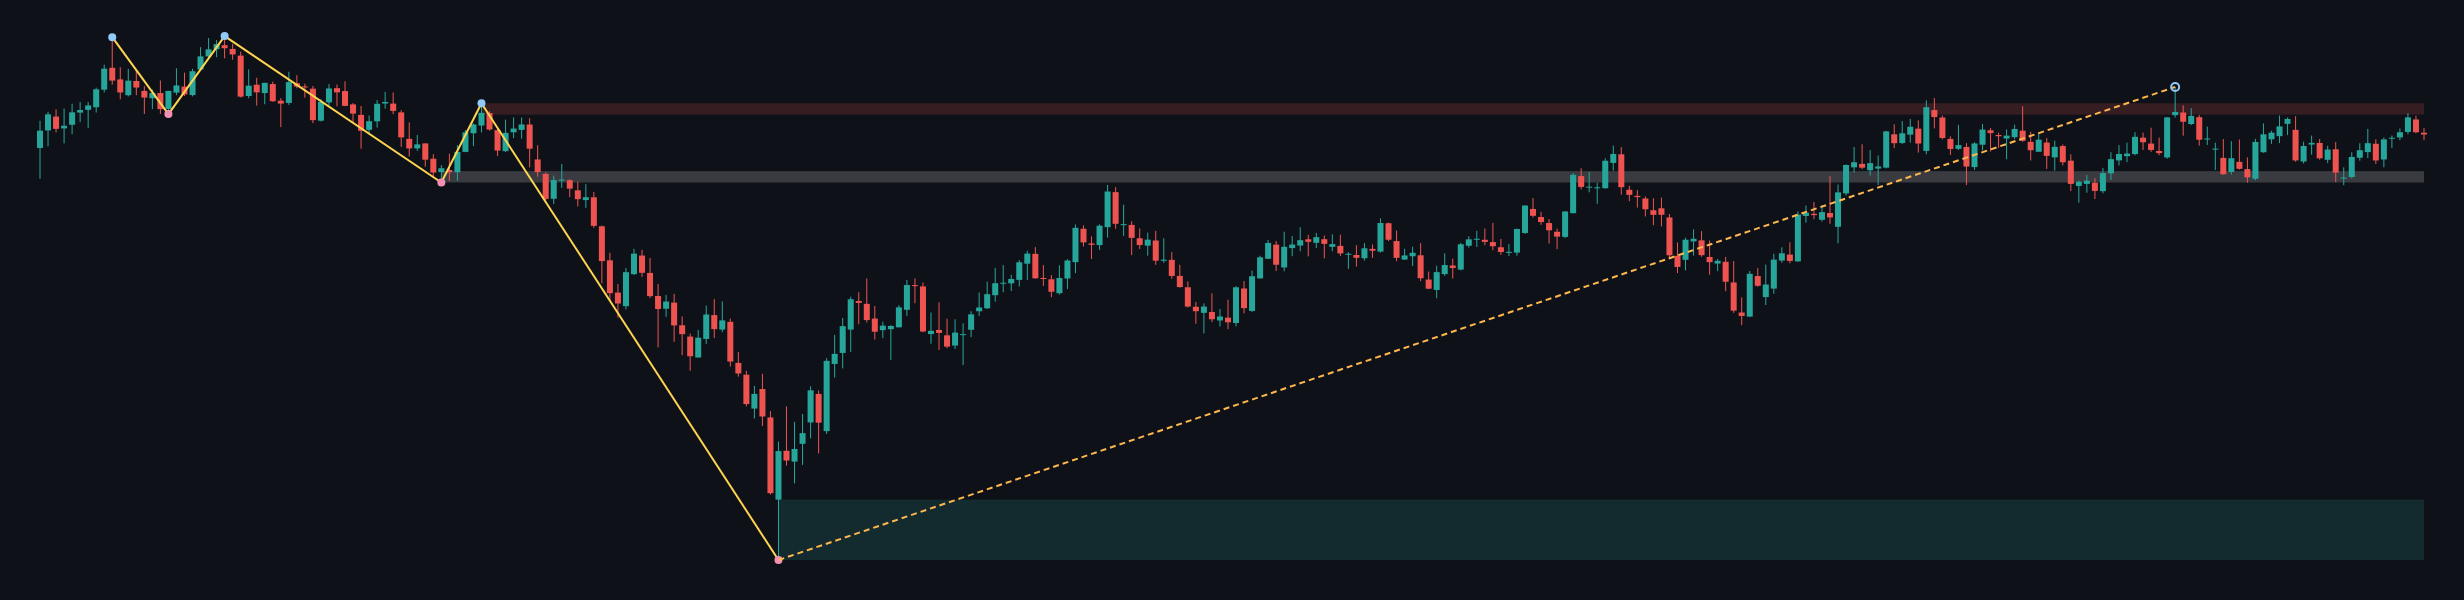
The weekly chart defines the larger constraint: its main trend is down and firm, although the sub-trend is up. No weekly structure event is recorded, so the recent recovery has not yet changed the principal directional classification. The most recent confirmed weekly swing is the low at 1.03535.
Price is below the weekly resistance zone at 1.36649–1.37487 and above the broader weekly support zone at 1.03535–1.08025. A former weekly support area at 1.31602–1.32440 is marked as broken-retest support, making it an important intermediate reference if the daily pullback extends. The weekly ATR is 0.01677, indicating that the higher-timeframe range is materially wider than the current daily structure.
The weekly chart does not provide a directly reported Fibonacci interaction for the current price. The main message is therefore structural: the upward sub-trend permits further recovery, but the firm weekly downtrend remains a ceiling until price can establish acceptance above the weekly resistance zone.
Main-frame structure
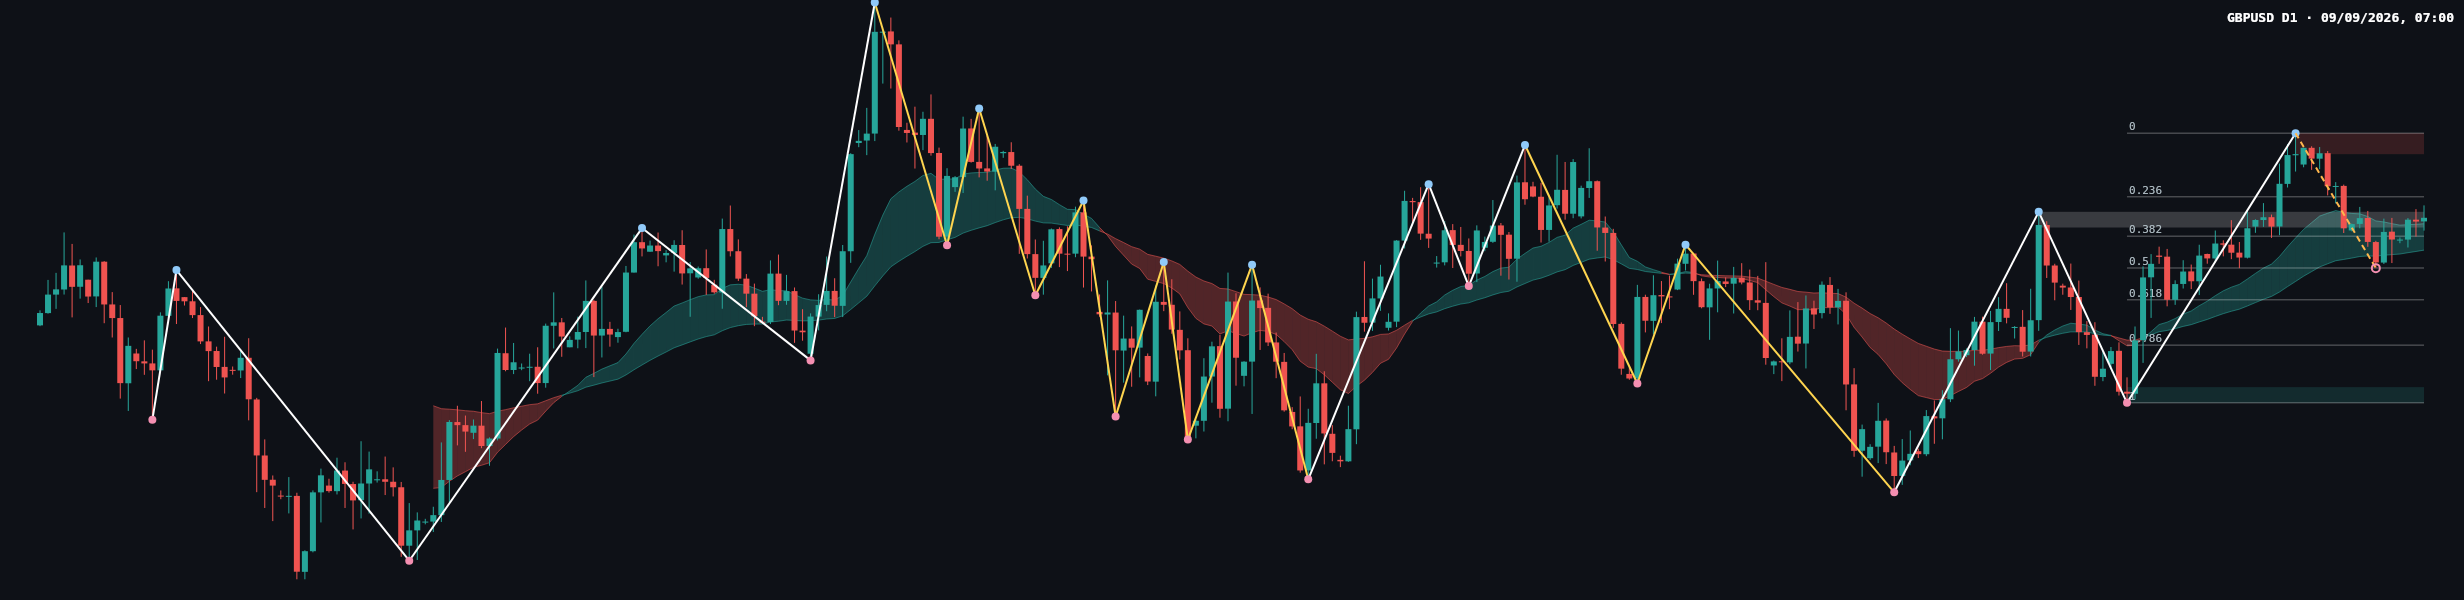
The daily main trend is up and firm, so it aligns with the weekly upward sub-trend but conflicts with the weekly primary trend. This is consistent with a recovery inside a larger downtrend, rather than a confirmed higher-timeframe reversal. The daily sub-trend is down, and no daily structure event is recorded.
The latest confirmed daily swing high is 1.36754. The daily resistance zone spans 1.36441–1.36754, placing the latest close below the area that must be reclaimed for the upward structure to regain momentum. On the downside, the daily support zone at 1.32730–1.32964 is the deeper structural reference, while 1.35346–1.35580 is the nearer broken-retest area.
The latest completed Dow leg has Fibonacci levels at 0: 1.36754, 0.236: 1.35804, 0.382: 1.35217, 0.5: 1.34742, 0.618: 1.34267, 0.786: 1.33591, and 1: 1.32730. The current retracement ratio is 0.314. The close at 1.35491 is below 0.236 at 1.35804 and above 0.382 at 1.35217, so the market is approaching a meaningful decision area.
Visually, the latest daily candles show a retreat from the swing high followed by compact, mixed candles near support. The recent sequence reflects seller control from the upper part of the range, but also hesitation as price approaches the broken-retest zone. There is no volume or momentum reading in the deterministic report, so confirmation from those measures is not determinable from the available data.
Key levels
- 1.36441–1.36754: daily resistance and the location of the most recent confirmed swing high.
- 1.36649–1.37487: weekly resistance, overlapping the upper part of the daily resistance region.
- 1.35346–1.35580: nearby daily broken-retest support surrounding the latest close.
- 1.35217: Fibonacci 0.382 level and the next downside reference beneath the nearby support zone.
- 1.34742 and 1.34267: Fibonacci 0.5 and 0.618 levels if the retracement deepens.
- 1.32730–1.32964: deeper daily support and the Fibonacci endpoint at 1.32730.
- 1.31602–1.32440: weekly broken-retest support below the daily structural zone.
Scenarios
Primary scenario: support produces a recovery
If price holds the daily support zone at 1.35346–1.35580 and reclaims the Fibonacci 0.236 level at 1.35804, the bullish daily structure would have room to retest 1.36441–1.36754. The scenario is invalidated by sustained acceptance below the nearby support zone, particularly if price also moves through 1.35217. This is the highest-ranked scenario while support remains intact.
Secondary scenario: range continuation
If price remains between the support area at 1.35346–1.35580 and resistance at 1.36441–1.36754, the conflicting weekly and daily structures may continue to produce sideways movement. In this case, the Fibonacci references between 1.35217 and 1.35804 help describe the internal pullback, but neither side has established control. A decisive close beyond either boundary would weaken this range scenario.
Risk scenario: deeper bearish retracement
If sellers secure acceptance below 1.35217, the next Fibonacci references are 1.34742, 1.34267, and 1.33591, with the daily support zone at 1.32730–1.32964 providing the deeper structural test. This scenario is invalidated if price reclaims and holds above the nearby support area after the breakdown. A deeper decline would strengthen the weekly downtrend argument and reduce the significance of the daily recovery.
What to monitor
The cleanest confirmation would come from the market's behaviour around 1.35346–1.35580 and 1.35217. A sustained recovery through 1.35804 would improve the bullish case, while rejection below 1.35217 would favour the deeper retracement path. The upper decision area remains 1.36441–1.36754, with the weekly supply zone at 1.36649–1.37487 overhead.
False breaks and liquidity sweeps are possible where the daily broken-retest zone overlaps the Fibonacci structure. Because no news or economic-calendar details were supplied, event risk and exact timing are not determinable from the report. Traders should account for volatility, avoid treating a single intraday move as structural confirmation, and keep exposure consistent with their own risk limits.
Summary
- The weekly main trend is down, while the daily main trend is up.
- The daily bearish sub-trend has brought price to 1.35346–1.35580 support.
- 1.35217 is the key Fibonacci 0.382 reference beneath that zone.
- A recovery through 1.35804 would reopen the path toward 1.36441–1.36754.
- A sustained move below 1.35217 would expose deeper Fibonacci support.
The single most important feature is whether buyers can defend 1.35346–1.35580 without losing 1.35217.
Meta description: GBPUSD balances a firm daily uptrend against a firm weekly downtrend as price tests 1.35346–1.35580 support and 1.35217 Fibonacci support.
This article is technical analysis and reference information only, not investment advice. Markets carry risk, and readers are responsible for their own decisions.