
GBPUSD is trading at a key multi-timeframe junction. The last closed price on the daily chart is 1.35463, positioned around the daily broken-retest support zone at 1.35340–1.35580 and close to the 0.382 Fibonacci level at 1.35217. The daily trend remains firmly up, while the weekly trend is firmly down with an upward sub-trend. This keeps both continuation and rejection scenarios active.
Higher-timeframe context — Weekly
The weekly structure remains defined as a firm downtrend with an upward sub-trend. No weekly structure event has been recorded, so the recent recovery has not yet produced a confirmed change in the primary direction. The most recent confirmed weekly swing is the low at 1.03535.
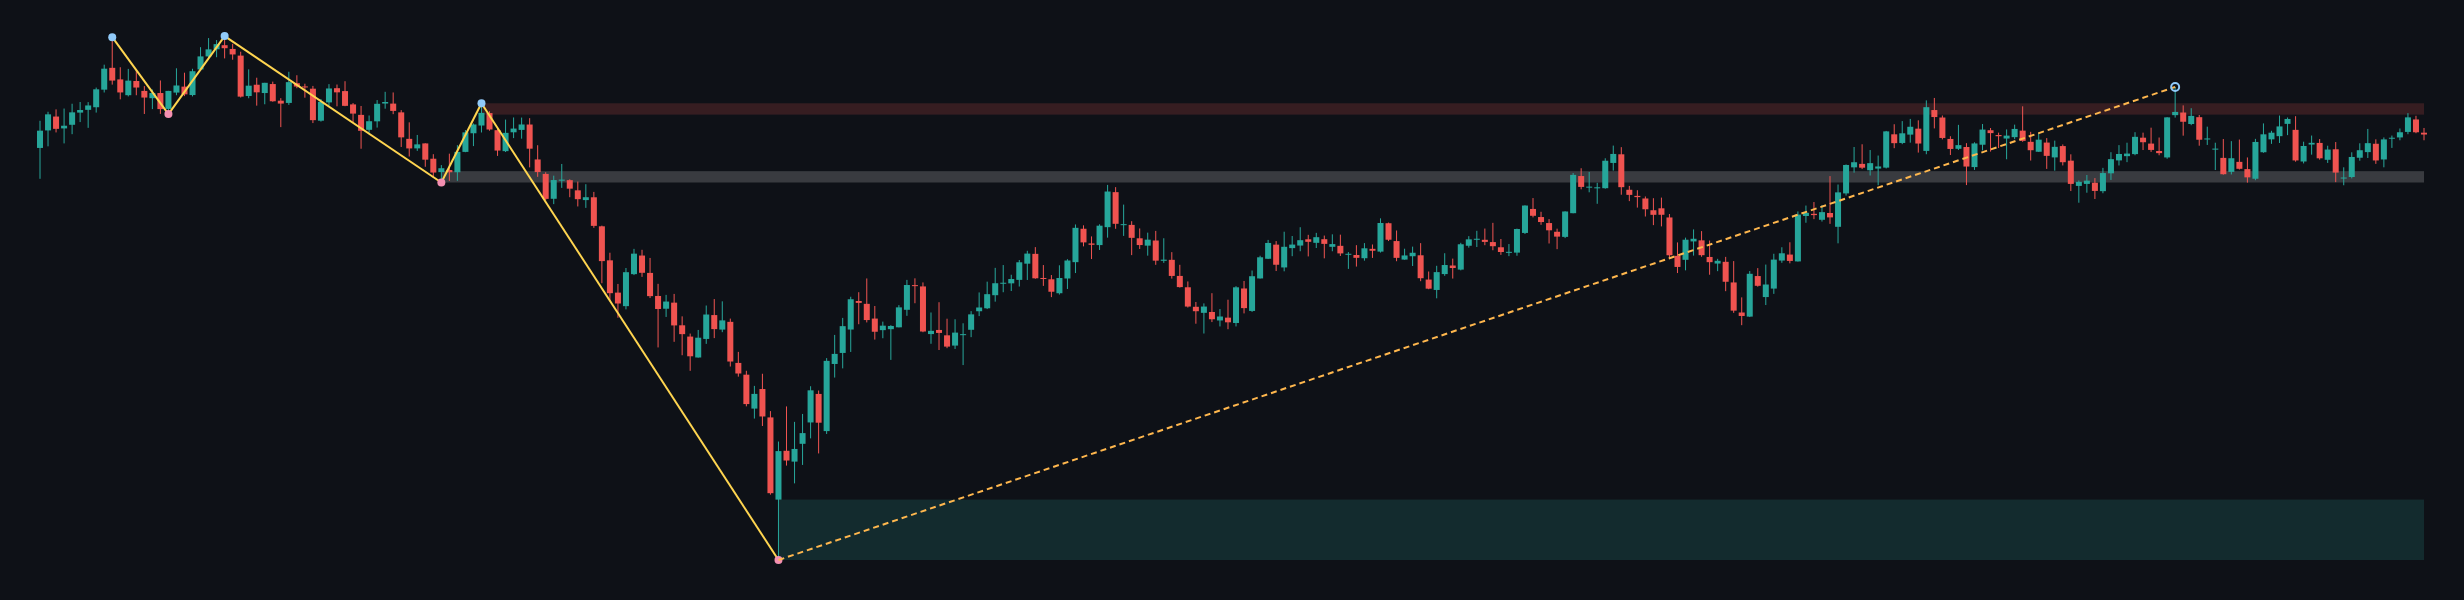
The most important weekly resistance is the zone at 1.36649–1.37487. The market is trading below this area, so a sustained approach toward that zone would place the recovery directly beneath higher-timeframe supply. The weekly broken-retest resistance zone at 1.31602–1.32440 is below the current market and has already been identified as broken-retest structure.
The larger weekly support zone is 1.03535–1.08025. It is well below the current price and is not an immediate decision area for the present consolidation. Weekly ATR is 0.01677, indicating that the broader chart has a materially wider range context than the daily frame.
The weekly conclusion is balanced but cautious: the upward sub-trend permits further recovery toward 1.36649–1.37487, while the firm primary downtrend keeps rejection from that zone relevant. No weekly structure break has confirmed a full bullish reversal.
Main-frame structure — Daily
The daily main trend is firmly up, while the sub-trend is down. This is a misalignment rather than a confirmed reversal because no daily structure event has been recorded. The recent decline can therefore be treated as a pullback within the daily advance unless price establishes acceptance below the nearby support structure.
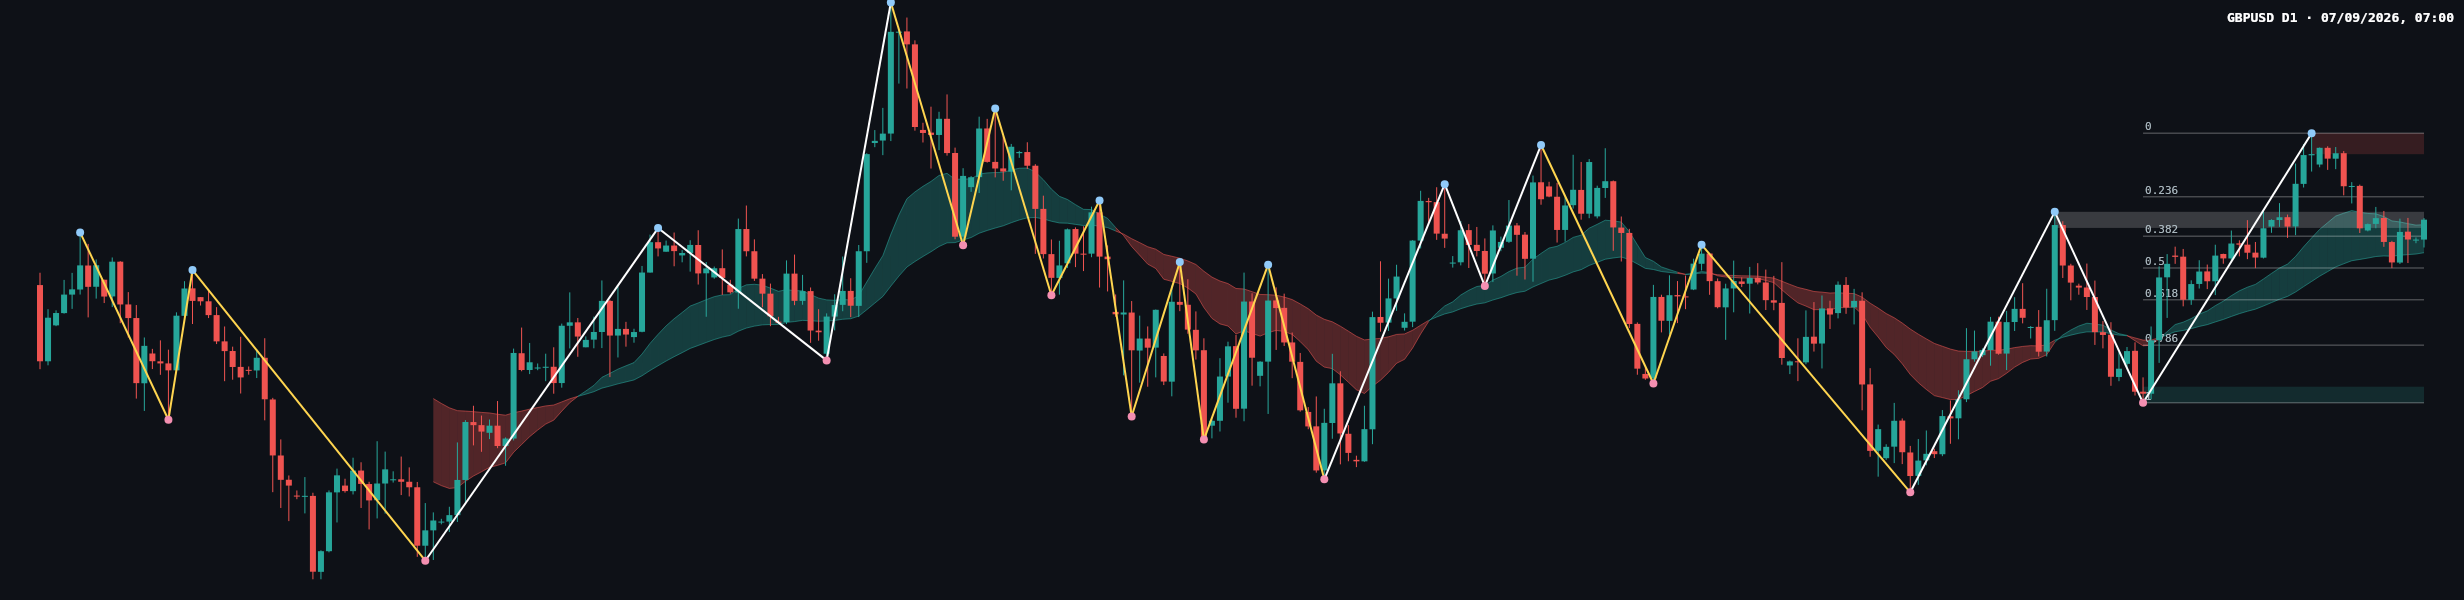
The latest confirmed daily swing high is 1.36754. The daily resistance zone is 1.36441–1.36754, overlapping the weekly resistance area at 1.36649–1.37487. This overlap makes the upper zone the clearest area where buyers would need to demonstrate continuation.
Near-term daily support is the broken-retest zone at 1.35340–1.35580. A deeper support zone is located at 1.32730–1.32970. Daily ATR is 0.00480, so movement around the current support and the upper resistance zone should be assessed against the daily range context rather than isolated candles.
The latest completed Dow leg has Fibonacci levels at 0: 1.36754, 0.236: 1.35804, 0.382: 1.35217, 0.5: 1.34742, 0.618: 1.34267, 0.786: 1.33591, and 1: 1.32730. The current retracement ratio is 0.321. With the last close at 1.35463, price is between 0.236: 1.35804 and 0.382: 1.35217, while the nearby broken-retest support spans 1.35340–1.35580.
Recent candles and closing-price reading
The most recent candles on the daily chart show a mixed, relatively compressed sequence around the broken-retest support zone at 1.35340–1.35580. The latest close at 1.35463 remains inside that zone and below 0.236: 1.35804. The visible candle sequence does not provide a sufficiently clear textbook classification such as a Marubozu, Pin bar, Doji, or Engulfing pattern from the deterministic report.
The closing location suggests neither a decisive bullish escape from support nor a confirmed bearish breakdown. Buyers have defended the area around 1.35340–1.35580, but sellers remain capable of keeping price below 1.35804 and away from 1.36441–1.36754. A daily close above 1.35804 would improve the recovery structure, while a close below 1.35217 would expose the lower Fibonacci levels, beginning with 1.34742.
EMA values, their exact slopes, and the spacing between EMA20 and EMA50 are not included in the deterministic report, so those details are not determinable here. Volume and momentum readings are also not supplied and cannot be used as confirmation.
Conditional scenarios
Bullish continuation scenario
- Trigger condition: price holds above 1.35340–1.35580 and then establishes acceptance above 1.35804.
- Potential objective zone: the daily resistance zone at 1.36441–1.36754, with the overlapping weekly zone at 1.36649–1.37487 as the broader area to observe.
- Invalidation: a sustained move below 1.35217 would weaken this continuation structure.
- Probability: an estimated percentage is not determinable from the supplied report.
Bearish rejection scenario
- Trigger condition: price fails to reclaim 1.35804 and breaks below the daily broken-retest support at 1.35340–1.35580.
- Potential objective zone: the Fibonacci area from 1.34742 toward 1.34267, with deeper support at 1.32730–1.32970 if weakness persists.
- Invalidation: a sustained recovery above 1.36441–1.36754 would undermine the rejection scenario.
- Probability: an estimated percentage is not determinable from the supplied report.
Range and failed-break scenario
- Trigger condition: price remains between the support zone at 1.35340–1.35580 and the resistance zone at 1.36441–1.36754 without a confirmed daily structure event.
- Potential objective zone: continued rotation between 1.35217 and 1.35804, with the wider boundaries defined by 1.35340–1.35580 and 1.36441–1.36754.
- Invalidation: a decisive close outside either boundary, particularly below 1.35217 or above 1.36754, would reduce the range interpretation.
- Probability: an estimated percentage is not determinable from the supplied report.
Key levels to monitor
| Area | Levels | Market relevance |
|---|---|---|
| Daily resistance | 1.36441–1.36754 | Recovery ceiling and latest confirmed swing-high area |
| Weekly resistance | 1.36649–1.37487 | Higher-timeframe supply above the daily market |
| Near support | 1.35340–1.35580 | Daily broken-retest area surrounding the latest close |
| Fibonacci support | 1.35217, 1.34742, 1.34267 | Potential pullback reference levels |
| Deeper daily support | 1.32730–1.32970 | Lower structural support zone |
The cleanest confirmation would be acceptance above 1.35804 followed by progress toward 1.36441–1.36754, or acceptance below 1.35217 followed by movement toward 1.34742. False breaks remain possible around both the broken-retest zone and the overlapping resistance areas.
Closing view
GBPUSD is holding near 1.35463 while the daily uptrend and weekly downtrend remain in conflict. The central question is whether the support area at 1.35340–1.35580 continues to contain the pullback or whether price breaks below 1.35217. Conversely, recovery above 1.35804 would put the resistance band at 1.36441–1.36754 back in focus.
Technical analysis is provided for reference only and is not investment advice. Markets carry risk, and readers are responsible for their own decisions.
#GBPUSD #ForexAnalysis #PriceAction #DowTheory #TechnicalAnalysis
Meta description: GBPUSD analysis: daily support at 1.35340–1.35580 faces resistance at 1.36441–1.36754 amid conflicting weekly and daily trends.