
GBPUSD is trading at a significant multi-timeframe decision area. The last closed price is 1.36374 on the daily chart and 1.36441 on the weekly chart. Daily structure remains firmly bullish after a break of 1.35580, but the weekly main trend is still firmly down and price is approaching the weekly resistance zone at 1.36602 – 1.37487.
Higher-timeframe context — Weekly
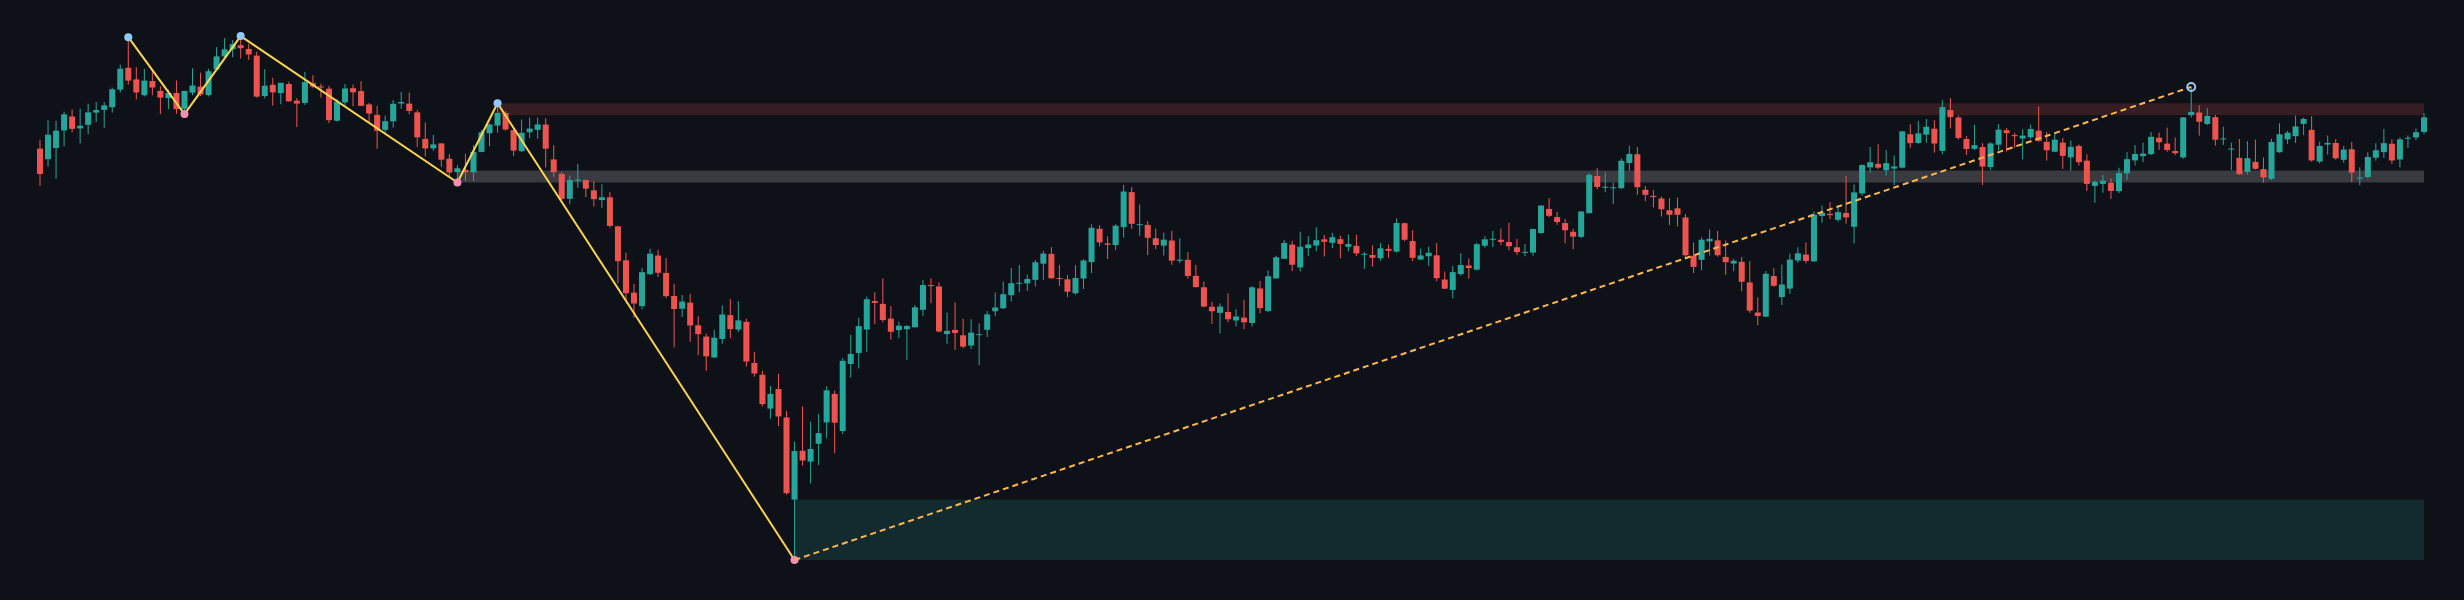
The weekly chart presents a downtrend as the primary Dow framework, with an upward sub-trend developing from the confirmed swing low at 1.03535. The deterministic report identifies no weekly structure event, so the upward move has not yet changed the stated primary trend.
Price is pressing toward weekly resistance at 1.36602 – 1.37487. A sustained move into or through this zone would test whether the current sub-trend can overcome the broader bearish framework. The previously broken-retest resistance zone at 1.31602 – 1.32487 is positioned below current price and remains an important structural reference.
The larger support zone is 1.03535 – 1.08025, with the most recent confirmed swing low at 1.03535. The weekly ATR is 0.01770, indicating that the broader chart can accommodate wider movement than the daily timeframe.
Weekly EMA20 and EMA50 positioning, spacing, and crossover status are not determinable from the deterministic report. Weekly Fibonacci interaction is also not supplied, so no specific weekly Fibonacci level can be confirmed.
Overall, the weekly chart permits further upside while the upward sub-trend persists, but it does not yet confirm a reversal of the firm primary downtrend. The resistance zone at 1.36602 – 1.37487 is therefore the main higher-timeframe test.
Main-frame structure — Daily
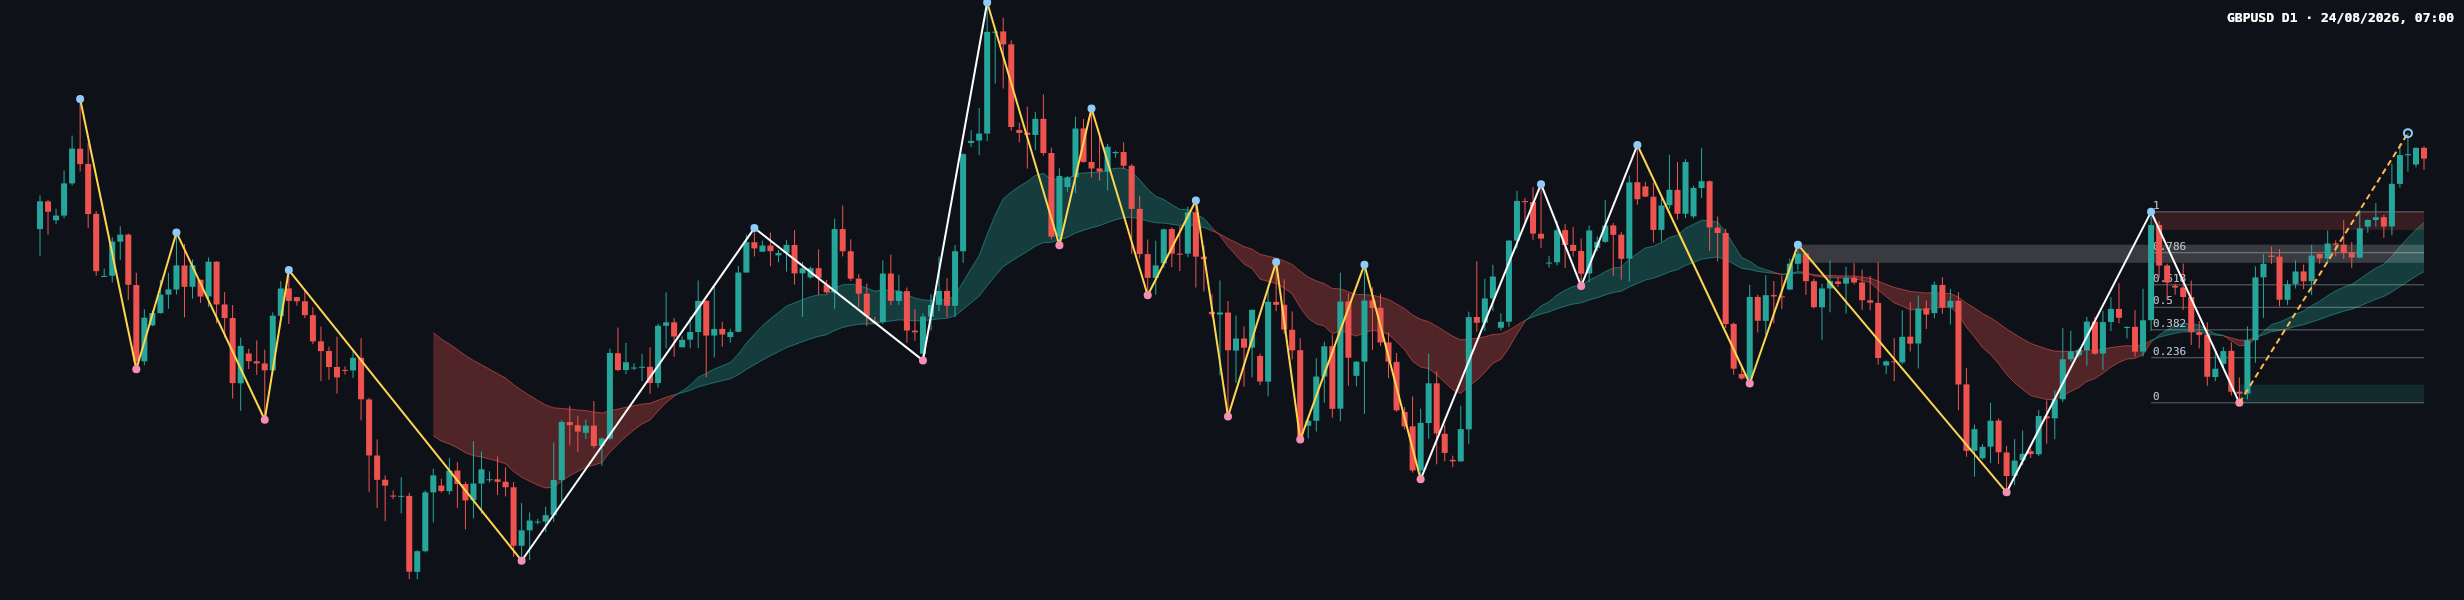
The daily trend is firmly up, and its sub-trend is also up. This is not fully aligned with the weekly primary trend: the daily move currently represents a bullish counter-trend phase within a broader weekly downtrend unless a larger weekly structure change develops.
The main daily structure event is a break of structure at 1.35580. The daily resistance zone is 1.35310 – 1.35580, which overlaps the broken level and can now be monitored as a possible broken-retest area. Daily support is located at 1.34820 – 1.35090, while the deeper support zone is 1.32730 – 1.33000. The most recent confirmed daily swing low is 1.32730.
The latest completed Dow leg runs from 1.32730 to 1.35580. Its Fibonacci levels are 0: 1.32730, 0.236: 1.33403, 0.382: 1.33819, 0.5: 1.34155, 0.618: 1.34491, 0.786: 1.34970, and 1: 1.35580. The current retracement ratio is 1.000, placing the reported reading at the completed-leg extreme rather than within a fresh pullback.
Daily EMA20 and EMA50 values, their slopes, spacing, and crossover status are not determinable from the deterministic report. The daily ATR is 0.00540, providing a narrower volatility reference than the weekly ATR.
Reading the most recent closing candle
The chart shows a small bearish candle after a recent upward push toward the latest swing high. Its body is relatively compact, with a visible upper wick, suggesting some rejection near the current highs rather than a clean, uninterrupted continuation candle.
The close at 1.36374 remains above the broken daily level at 1.35580 and above the daily resistance zone at 1.35310 – 1.35580. It is also close to the weekly resistance zone at 1.36602 – 1.37487. This leaves buyers with a structural advantage on the daily timeframe, while the upper wick warns that sellers are becoming active as price approaches weekly supply.
Compared with the preceding upward sequence, the latest candle looks more like a pause or warning candle than a confirmed reversal. Confirmation would require either continued acceptance above the current daily structure or a clear rejection followed by a move back through the broken-retest zones.
Key levels
- Weekly resistance: 1.36602 – 1.37487.
- Daily resistance and broken structure: 1.35310 – 1.35580, with the break recorded at 1.35580.
- Daily broken-retest support: 1.34820 – 1.35090.
- Deeper daily support: 1.32730 – 1.33000.
- Weekly broken-retest zone: 1.31602 – 1.32487.
- Weekly major support: 1.03535 – 1.08025.
Scenarios
Primary scenario: daily continuation toward weekly resistance
If price holds above 1.35580 and continues to build acceptance above the daily resistance zone at 1.35310 – 1.35580, the bullish daily structure remains active. The next major zone to test is weekly resistance at 1.36602 – 1.37487. Invalidation would be a sustained return below the broken-retest support zone at 1.34820 – 1.35090. An estimated percentage probability is not provided in the deterministic report.
Secondary scenario: rejection from weekly resistance
If price rejects the weekly resistance zone at 1.36602 – 1.37487, sellers could press the market back toward the daily structure area at 1.35310 – 1.35580. The scenario would be weakened or invalidated by sustained acceptance above 1.37487. An estimated percentage probability is not provided in the deterministic report.
Risk scenario: deeper daily reversal
If price breaks below 1.34820 – 1.35090, the recent daily bullish sequence would be under pressure. The deeper support zone at 1.32730 – 1.33000 would then become the next major area to observe. Invalidation would be a recovery above the broken structure level at 1.35580. An estimated percentage probability is not provided in the deterministic report.
Key considerations for the session
The central checklist is the interaction with 1.36602 – 1.37487 above and the ability of price to remain above 1.35310 – 1.35580 below. Between those areas, the market may remain sensitive to short-term rejection and consolidation. The zones at 1.34820 – 1.35090 and 1.32730 – 1.33000 are the main downside areas worth observing if the daily structure weakens.
For bullish confirmation, traders can monitor whether daily closes remain above 1.35580 and whether any retest of 1.35310 – 1.35580 holds. For bearish confirmation, attention should turn to rejection from 1.36602 – 1.37487 followed by a loss of 1.35310 – 1.35580. These are observation conditions, not order instructions.
False breakouts are a material risk near the weekly resistance zone, particularly because the weekly primary trend remains down. A short-lived move above resistance followed by a close back below it would carry a different message from sustained acceptance. The report contains no news or economic-calendar information, so no specific event window can be identified. Volume and momentum readings are also not supplied in the deterministic report.
General risk control remains important in either direction: account for the daily ATR of 0.00540 and weekly ATR of 0.01770, avoid treating a single candle as confirmation, and assess exposure according to personal risk limits. The Asian, European, and US session effects cannot be quantified from the supplied report.
Summary
- The daily trend and sub-trend are firmly up, with a break of structure at 1.35580.
- The weekly primary trend remains firmly down, although its sub-trend is up.
- Weekly resistance at 1.36602 – 1.37487 is the immediate higher-timeframe test.
- Daily support at 1.34820 – 1.35090 is the first downside structure area to monitor.
- A move below 1.32730 – 1.33000 would indicate a deeper daily deterioration.
The single most important thing today is whether price can sustain the daily bullish structure while approaching 1.36602 – 1.37487 weekly resistance.
#GBPUSD #ForexAnalysis #PriceAction #DowTheory #TechnicalAnalysis
Meta description: GBPUSD daily analysis: bullish structure above 1.35580 meets weekly resistance at 1.36602 – 1.37487.
This article is technical analysis and reference information only, not investment advice. Markets carry risk, and readers are responsible for their own decisions.