
GBPUSD is positioned between a firm weekly uptrend and a sideways daily structure with a down sub-trend. The last closed prices are 1.34804 on the weekly context frame and 1.34908 on the daily frame, leaving price inside the daily broken-retest support zone at 1.34731–1.35090. The most notable feature is the compressed decision area between this support and daily resistance at 1.35221–1.35580.
Higher-timeframe context
The weekly main trend is up and described as firm, while the weekly sub-trend is down. No weekly structure event has been confirmed, so the broader advance remains intact, but the recent pullback means the market is not moving in a clean one-way sequence. The most recent confirmed weekly swing is a high at 1.38704.
Weekly support is marked at 1.30097–1.31346. A higher support area is also identified at 1.36985–1.37884, described as a broken-retest zone. Weekly resistance is located at 1.37816–1.38704. With the weekly close at 1.34804, price is below the higher-timeframe resistance areas and above the deeper support zone.
The weekly ATR is 0.01776. Weekly EMA values, their exact spacing, and any crossover are not determinable from the supplied numerical report. The weekly Fibonacci interaction is also not specified in the report, so no weekly Fibonacci level is assigned here.
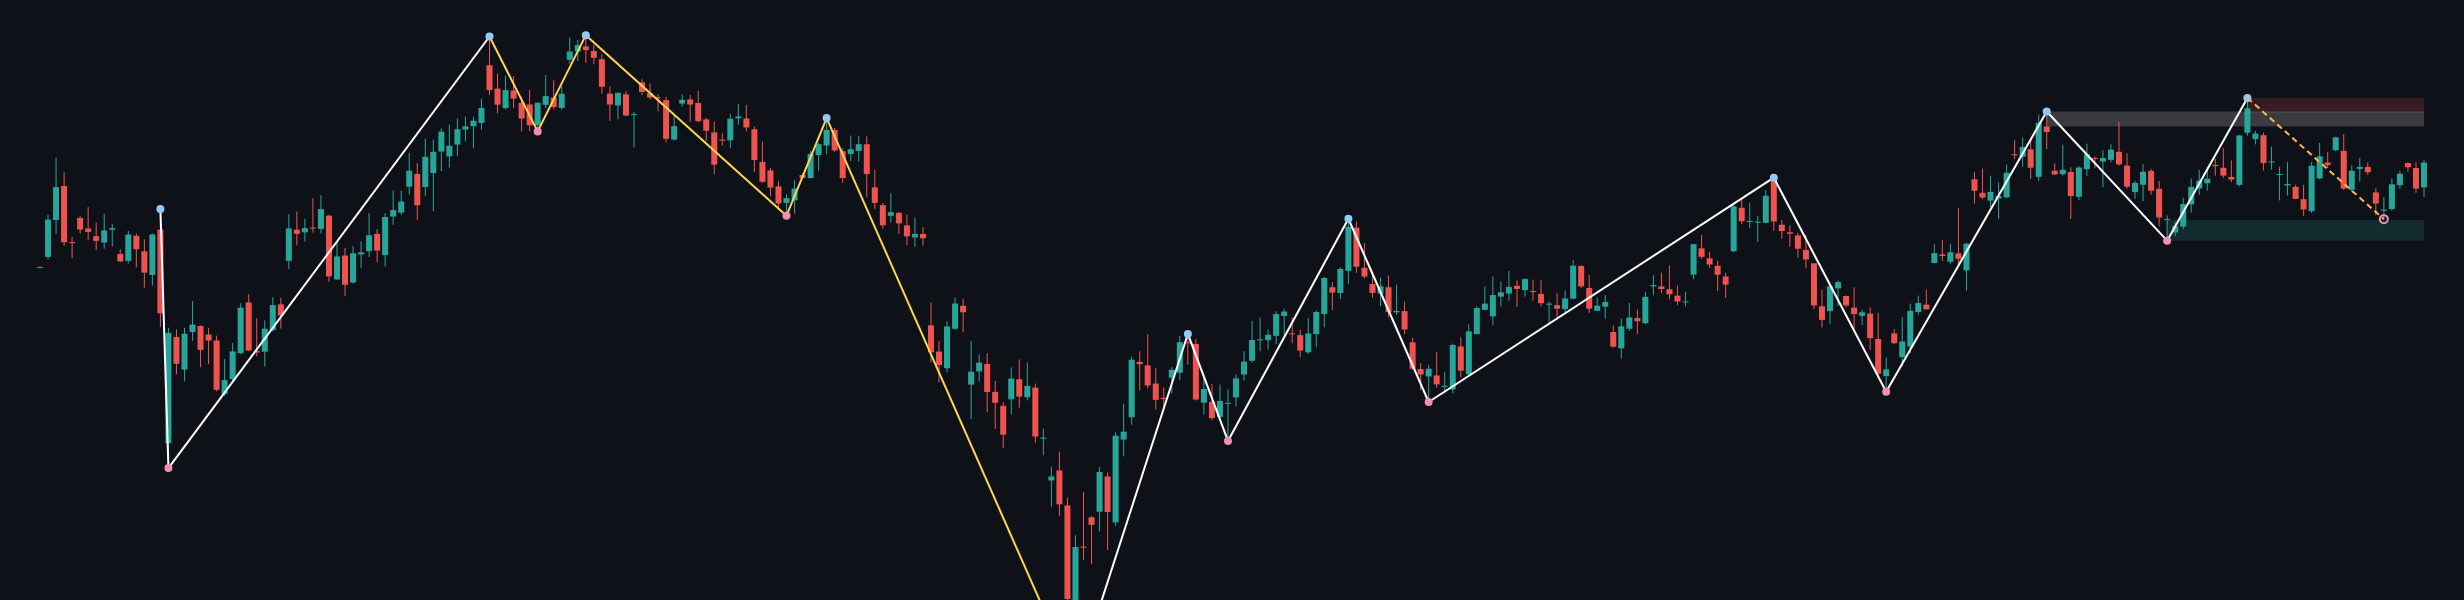
The higher-timeframe framework permits a bullish continuation if price can recover through the daily resistance structure, but it also leaves room for a deeper correction toward weekly support if the daily support zone fails. Until one of those conditions occurs, the weekly uptrend and daily hesitation should be treated as competing signals rather than a confirmed reversal.
Main-frame structure
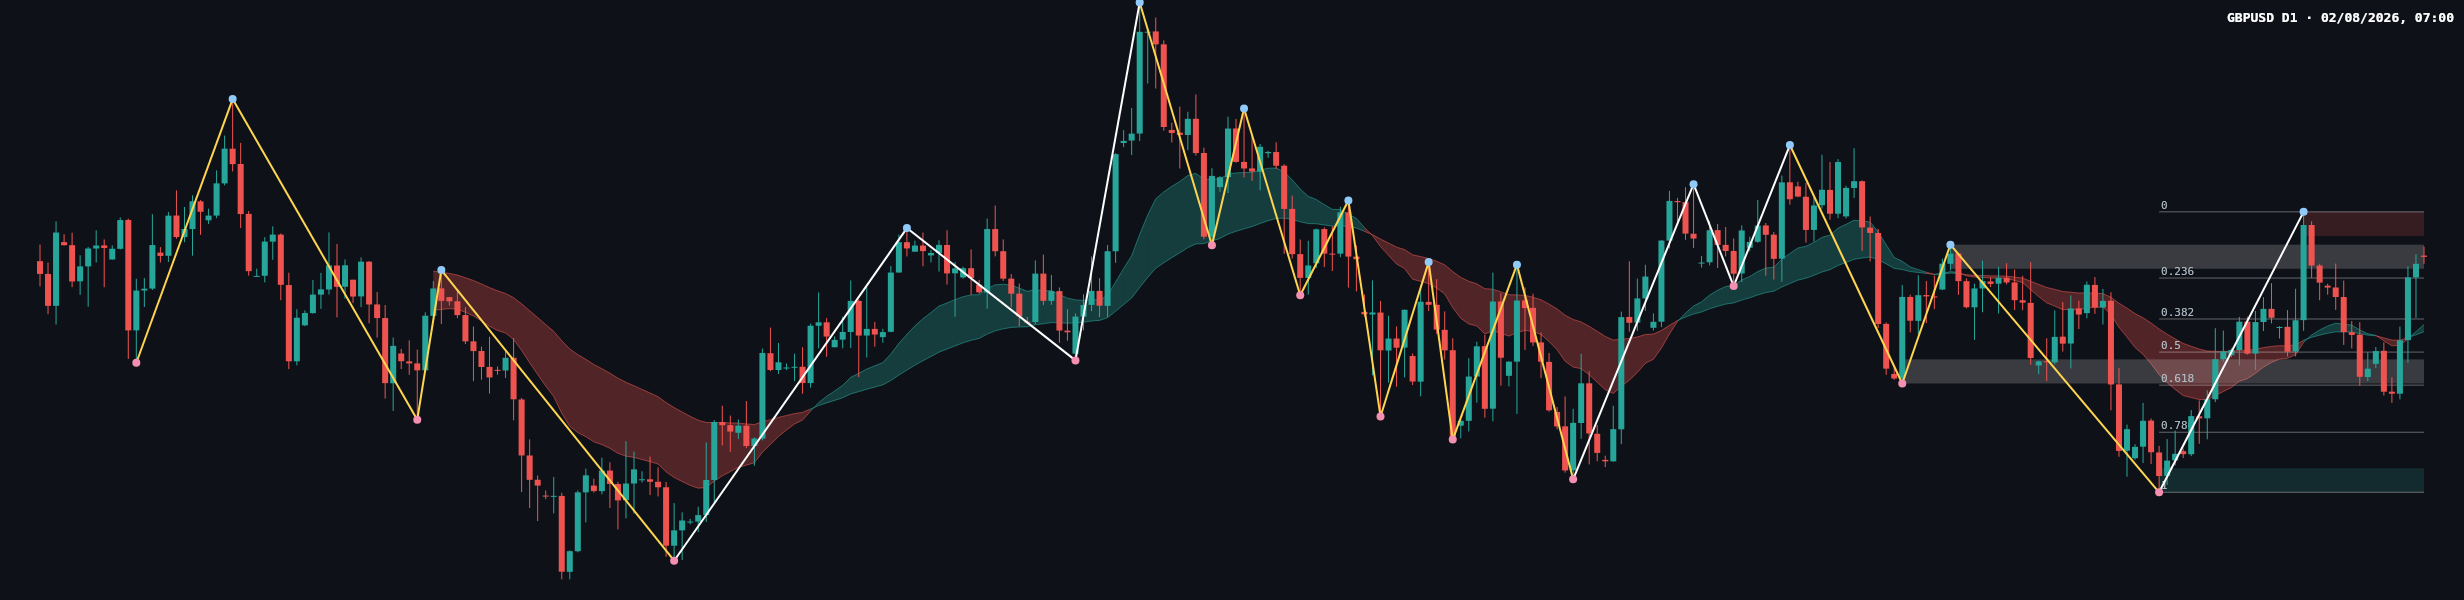
The daily main trend is sideways and firm, while the sub-trend is down. This is not fully aligned with the weekly uptrend. It can therefore represent a corrective phase within the broader advance, although a sustained move below daily support would increase the risk that the correction is becoming a more consequential bearish structure.
No daily structure event has been confirmed. The most recent confirmed daily swing is a high at 1.35580. The daily ATR is 0.00718, indicating that the space between support and resistance can be meaningful relative to the current consolidation.
The daily Fibonacci leg runs from 0: 1.35580 to 1: 1.31395. The listed retracement levels are 0.236: 1.34592, 0.382: 1.33981, 0.5: 1.33487, 0.618: 1.32994, and 0.786: 1.32291. The current retracement ratio is 0.161.
Price at 1.34908 is above the 0.236: 1.34592 Fibonacci level and remains close to the daily broken-retest support at 1.34731–1.35090. The nearby resistance zone at 1.35221–1.35580 contains the latest confirmed swing high, while the broken-retest resistance at 1.33019–1.33378 sits lower and overlaps the broader retracement path.
Key levels and the latest candle
| Area | Level | Technical role |
|---|---|---|
| Daily resistance | 1.35221–1.35580 | Nearest upside barrier and latest confirmed swing-high area |
| Daily broken-retest support | 1.34731–1.35090 | Immediate balance and acceptance area |
| Fibonacci reference | 0.236: 1.34592 | First lower retracement reference beneath immediate support |
| Lower daily support | 1.31395–1.31754 | Deeper support and the lower end of the completed leg |
| Weekly resistance | 1.37816–1.38704 | Major higher-timeframe supply area |
The latest daily candle is bullish in appearance on the supplied chart, with the close at 1.34908 located inside the immediate support zone. The exact candle classification, wick proportions, and relative range are not determinable from the numerical report alone. Visually, the candle suggests that buyers defended the lower area into the close, but it does not yet establish control because the daily resistance zone at 1.35221–1.35580 remains overhead.
Relative to the preceding swings, the latest move is better read as a reaction from lower levels than as a confirmed trend change. A close above 1.35580 would provide stronger evidence of renewed upside structure; a move below 1.34731 would weaken the current defense. Volume and a separate momentum reading are not supplied, so confirmation or divergence from those measures is not determinable.
Conditional scenarios
Bullish continuation
Trigger: price establishes acceptance above the daily resistance zone at 1.35221–1.35580, preferably with a successful retest of that area. Upside reference: the next larger resistance zone is the weekly area at 1.37816–1.38704. Invalidation: renewed acceptance below the daily broken-retest support at 1.34731–1.35090. The probability of this scenario is not determinable from the report.
Range continuation
Trigger: price remains between the immediate support at 1.34731–1.35090 and resistance at 1.35221–1.35580, without a confirmed daily structure event. Reference range: those same zones define the active balance area. Invalidation: a sustained break beyond either boundary, particularly a close above 1.35580 or below 1.34731. The probability of this scenario is not determinable from the report.
Bearish correction
Trigger: price breaks and holds below 1.34731–1.35090, followed by weakness beneath the nearby Fibonacci reference at 1.34592. Downside reference: the daily support zone at 1.31395–1.31754, with the intervening Fibonacci levels at 1.33981, 1.33487, 1.32994, and 1.32291 providing structure along the path. Invalidation: recovery above 1.35580. The probability of this scenario is not determinable from the report.
The daily bias therefore remains balanced to slightly cautious while price trades inside 1.34731–1.35090. The weekly trend favors keeping bullish continuation in view, but the daily down sub-trend requires confirmation above 1.35580.
Key considerations
- Levels to watch: near resistance is 1.35221–1.35580; higher resistance is 1.37816–1.38704. Near support is 1.34731–1.35090; lower support is 1.31395–1.31754.
- Fibonacci references: monitor 0.236: 1.34592, 0.382: 1.33981, 0.5: 1.33487, 0.618: 1.32994, and 0.786: 1.32291 if support gives way.
- Confirmation: bullish confirmation would require acceptance above 1.35580; bearish confirmation would require sustained trade below 1.34731–1.35090 and follow-through beneath 1.34592.
- Traps: a brief move through either edge of the immediate zone may be a false break unless the daily close and subsequent retest support the move.
- Fundamental context: no news or economic-calendar information is supplied with this analysis. Traders should independently monitor scheduled data, central-bank communication, yield changes, currency-market shifts, and geopolitical headlines.
- Risk awareness: this structure does not establish a trade instruction. Any market exposure should account for volatility, invalidation risk, and the possibility that price remains range-bound.
Summary
- The weekly trend is up and firm, but the weekly sub-trend is down.
- The daily chart is sideways with a down sub-trend and no confirmed structure event.
- The immediate decision zone is 1.34731–1.35090.
- A move above 1.35221–1.35580 would improve the bullish structure, while weakness below 1.34731–1.35090 would expose lower Fibonacci and support references.
- The single most important thing today is whether price is accepted above 1.35580 or rejected back below 1.34731–1.35090.
Hashtags: #GBPUSD #Forex #PriceAction #DowTheory #TechnicalAnalysis
Meta description: GBPUSD analysis: weekly uptrend, daily balance, key support at 1.34731–1.35090 and resistance at 1.35221–1.35580.
This article is technical analysis and reference information only, not investment advice. Markets carry risk, and readers are responsible for their own decisions.