
GBPUSD presents a mixed multi-timeframe picture. The weekly framework remains firmly down, although its sub-trend is up, while the daily chart is sideways with a down sub-trend. The latest daily close at 1.34601 sits below the daily broken-retest area at 1.34721–1.35090 and below the broader resistance zone at 1.35211–1.35580. This leaves the market in a decision area: buyers need to reclaim overhead supply, while sellers need to preserve the recent rejection structure.
Higher-timeframe context: weekly structure
The weekly main trend is down and described as firm, while the sub-trend is up. No weekly structure event is reported, so there is no confirmed break of the prevailing weekly structure. The most recent confirmed weekly swing is a low at 1.07621, which keeps the broader directional framework vulnerable to renewed selling if the current upward phase fails.
Price is trading above the weekly broken-retest resistance zone at 1.31602–1.32591, but the next major weekly resistance zone is 1.35906–1.36895. The weekly last closed price is 1.33239. Relative to that close, the market is above the former broken-retest area but remains below the higher resistance zone. The principal weekly support zone is 1.07621–1.08610.
The weekly ATR is 0.01979, indicating a materially wider higher-timeframe movement envelope than the daily ATR of 0.00739. Exact weekly moving-average values, slopes, spacing and crossover status are not determinable from the report. Weekly Fibonacci values are also not provided, so interaction with a specific weekly Fibonacci level cannot be confirmed.
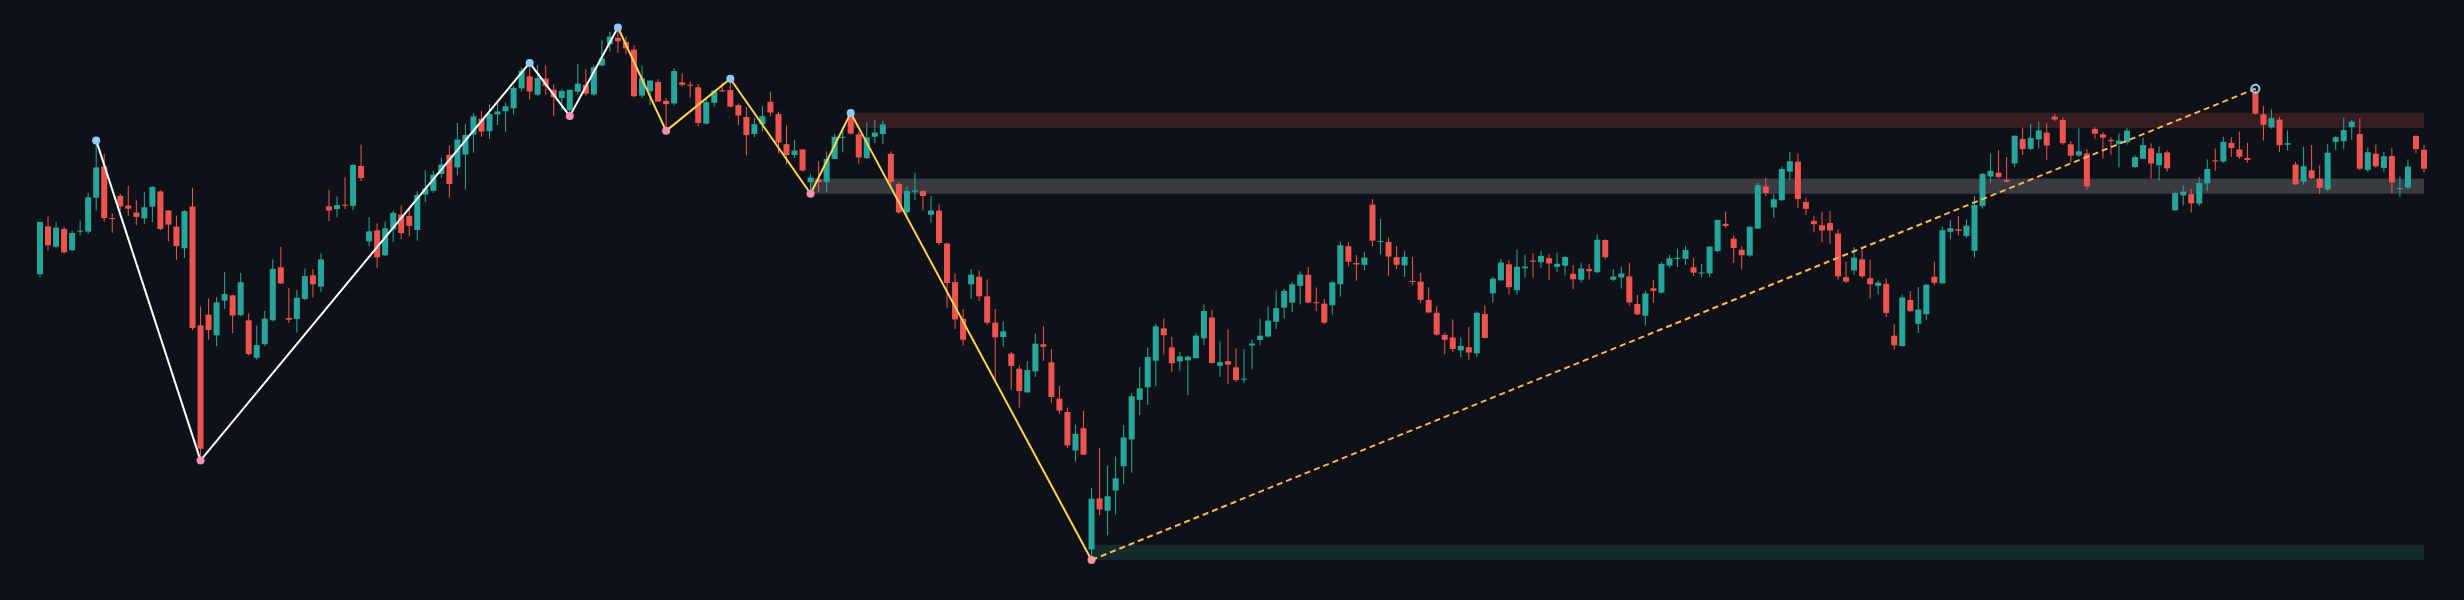
Weekly conclusion: The higher timeframe permits further recovery while price holds above 1.31602–1.32591, but the firm weekly downtrend means the zone at 1.35906–1.36895 remains an important test rather than an established bullish reversal.
Main-frame structure: daily chart
The daily trend is sideways and firm, with a down sub-trend. This does not align cleanly with the weekly combination of a firm downtrend and an upward sub-trend. The difference is best treated as a consolidation within a larger contested phase, rather than as a confirmed reversal, because the daily report records no structure event.
The most recent confirmed daily swing is a high at 1.35580. The daily resistance zone is 1.35211–1.35580, while the nearby broken-retest resistance zone is 1.34721–1.35090. Lower down, support is located at 1.31395–1.31764, with another broken-retest resistance zone at 1.33019–1.33388 that may act as a support or resistance reference depending on future closes.
The latest completed Dow leg has Fibonacci levels at 0: 1.35580, 0.236: 1.34592, 0.382: 1.33981, 0.5: 1.33487, 0.618: 1.32994, 0.786: 1.32291 and 1: 1.31395. The current retracement ratio is 0.234. The latest close at 1.34601 is close to the 0.236: 1.34592 level, making that Fibonacci reference relevant to the immediate balance between continuation and recovery.
The chart shows a recent rise from the lower part of the daily swing toward 1.35580, followed by rejection and a retreat into the middle of the recent range. The latest candles show alternating buying and selling pressure rather than a clean directional expansion. Exact candle ranges, wick proportions and volume readings are not supplied by the deterministic report, so those details are not determinable with precision.
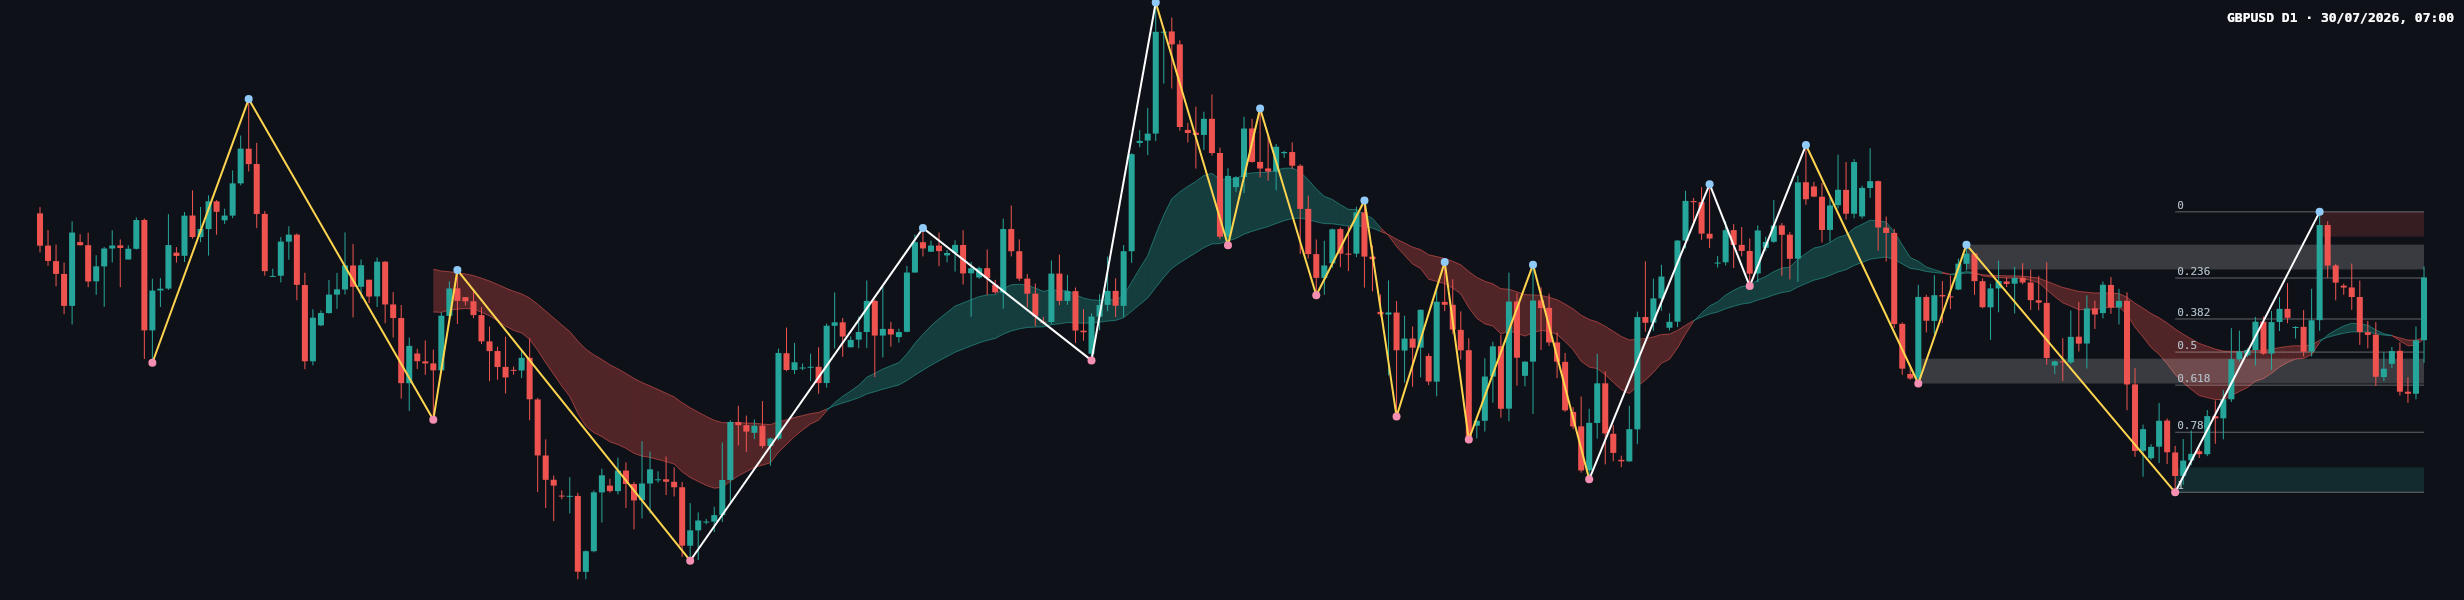
Daily conclusion: The daily market remains range-bound between support near 1.31395–1.31764 and resistance near 1.35211–1.35580. The close below 1.34721–1.35090 keeps the short-term tone cautious until that broken-retest zone is reclaimed.
Reading the most recent closing candle
The report identifies the latest daily close as 1.34601, but it does not classify the candle or provide its open, high, low, body size or wick measurements. Its precise type—such as a pin bar, engulfing candle, doji or marubozu—is therefore not determinable from the report.
Its location is nevertheless important in relation to the supplied levels. The close is below 1.34721–1.35090 and close to 0.236: 1.34592. A sustained hold below the broken-retest zone would support the sellers’ case for a deeper retracement toward 1.33981, 1.33487 or 1.32994. Conversely, a daily close back above 1.35090 would weaken the immediate bearish interpretation and bring 1.35211–1.35580 back into focus.
Conditional scenarios
Primary scenario: continued range pressure
If price remains below 1.34721–1.35090 and selling pressure persists around 0.236: 1.34592, the market could rotate toward 1.33981 and then the broader support reference at 1.33019–1.33388. This scenario is invalidated by a sustained daily reclaim of 1.35090. No probability estimate is provided because probabilities are not part of the deterministic report.
Secondary scenario: bullish recovery through the broken-retest zone
If buyers secure a daily close above 1.35090, the recovery could extend toward the resistance zone at 1.35211–1.35580. A move through that zone would place the weekly resistance area at 1.35906–1.36895 in view. This scenario is invalidated if price returns below 1.34721 after the attempted reclaim.
Risk scenario: deeper bearish retracement
If price breaks below 1.33981 and then loses the support reference at 1.33019–1.33388, the next Fibonacci references are 1.32994, 1.32291 and 1.31395, with the daily support zone at 1.31395–1.31764. This bearish extension is invalidated by a recovery above 1.33388 followed by acceptance back inside the broken-retest area.
The current bias leans cautiously bearish while price remains below 1.34721–1.35090, but the expected environment remains a range until one of the marked boundaries produces a confirmed daily close.
Key levels and considerations
- Near resistance: 1.34721–1.35090.
- Higher resistance: 1.35211–1.35580.
- Weekly resistance: 1.35906–1.36895.
- Near Fibonacci reference: 0.236: 1.34592.
- Lower Fibonacci references: 0.382: 1.33981, 0.5: 1.33487 and 0.618: 1.32994.
- Lower support: 1.31395–1.31764.
The cleanest signals would come from acceptance above 1.35090 or sustained weakness below 1.33981. A brief intraday move through either boundary without a confirming daily close would carry false-breakout risk. The broken-retest zone at 1.33019–1.33388 also deserves attention because it may determine whether a pullback finds demand or develops into a broader retracement.
No news, economic-calendar event, currency-index reading or yield data is included in the report. Those external factors should be checked separately, especially before interpreting a move through 1.35211–1.35580 or 1.31395–1.31764. General risk controls remain important in a sideways market: avoid treating a single candle as confirmation, keep exposure proportionate to volatility, and account for the daily ATR of 0.00739 and weekly ATR of 0.01979. Session-specific behaviour is not determinable from the supplied data.
Summary
- The weekly trend is firmly down, with an upward sub-trend and no reported structure break.
- The daily chart is sideways with a down sub-trend, and the latest close is 1.34601.
- The immediate decision area is the broken-retest zone at 1.34721–1.35090.
- A recovery above 1.35090 would refocus attention on 1.35211–1.35580.
- Failure below 1.33981 could expose 1.33019–1.33388 and the lower Fibonacci references.
The single most important thing today is whether GBPUSD can reclaim 1.35090 or remains capped beneath that broken-retest zone.
This article is technical analysis and reference information only, not investment advice. Markets carry risk, and readers are responsible for their own decisions.