
BTCUSD closed at 81237.55. The broader weekly and daily trends remain down, although both frames show an upward sub-trend. The market is now approaching the daily resistance zone at 81426.29–82844.58, while the weekly broken-retest resistance zone at 80538.63–84683.30 provides additional overhead context. A sustained move through these areas would improve the short-term bullish structure; rejection would keep the dominant bearish trend in control.
Higher-timeframe context
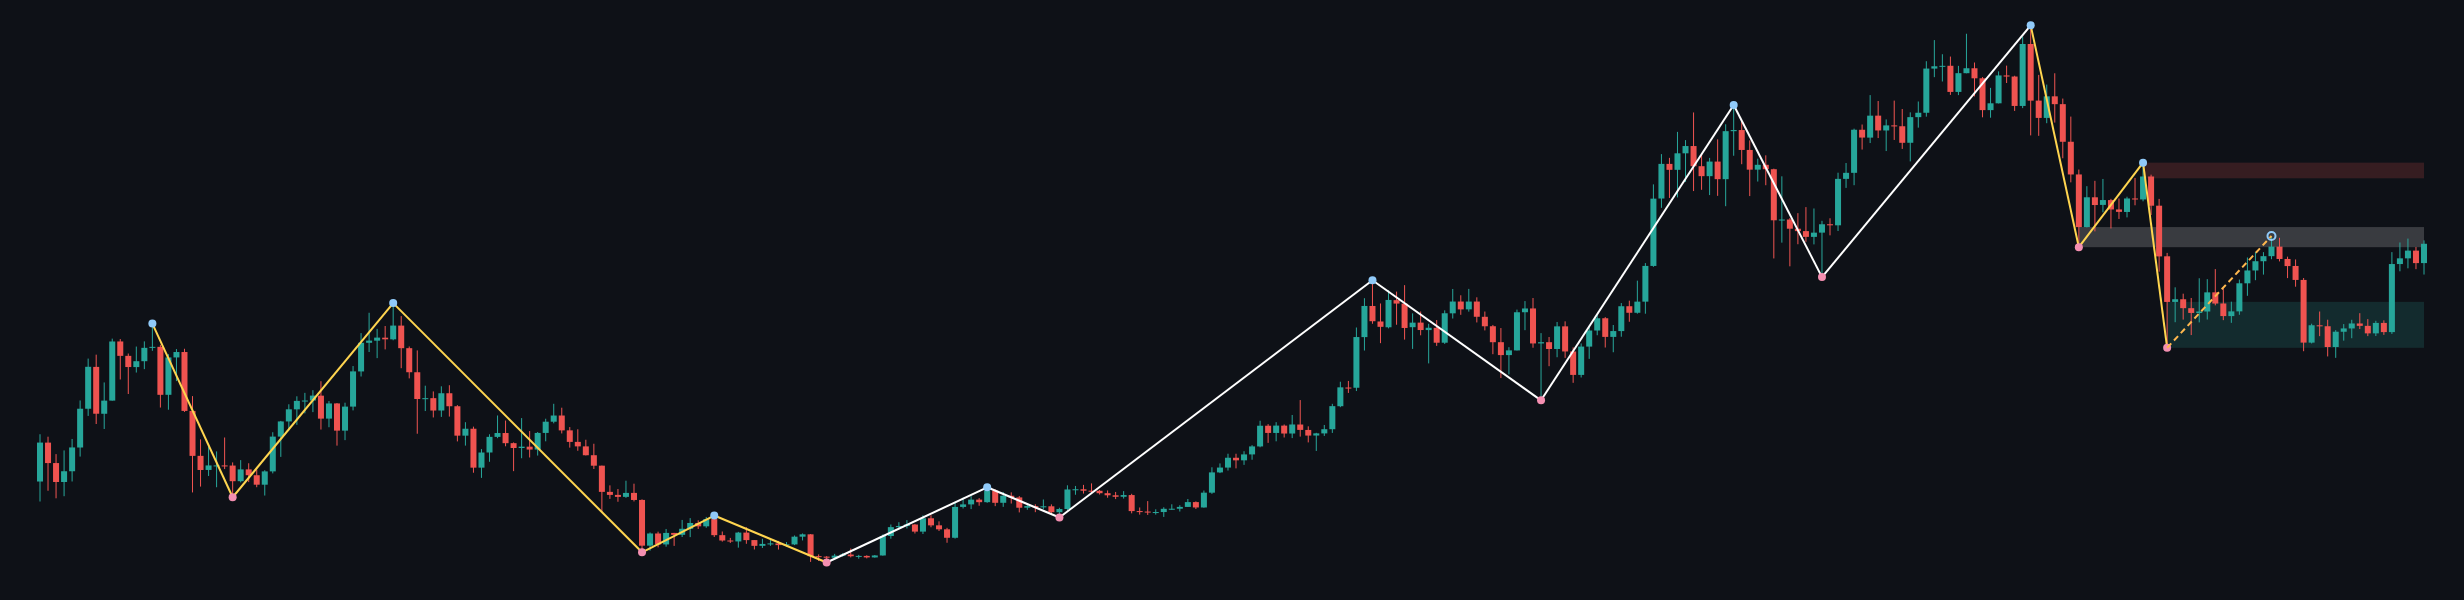
The weekly framework remains firmly bearish, with the main trend classified as down and the sub-trend classified as up. The most recent confirmed weekly swing is a low at 59783.75, and no new structure event has been recorded. This means the upward movement should currently be treated as a counter-trend advance rather than confirmed evidence of a broader reversal.
Price is trading around the weekly broken-retest resistance zone at 80538.63–84683.30. The latest close at 81237.55 is inside that area, so the market is not in open space on the higher timeframe. The next major resistance zone is 94752.29–97971.19. Weekly support is located at 59783.75–69241.82. The weekly ATR is 6437.79, indicating that movement around these zones can be substantial.
The supplied report does not provide numerical values for the weekly moving averages, so their exact position, spacing and crossover status are not determinable from the report. No weekly structure break has occurred. The higher-timeframe conclusion is therefore conditional: continued acceptance above 84683.30 would strengthen the upward sub-trend, while rejection from 80538.63–84683.30 would preserve the broader bearish framework.
Main-frame structure
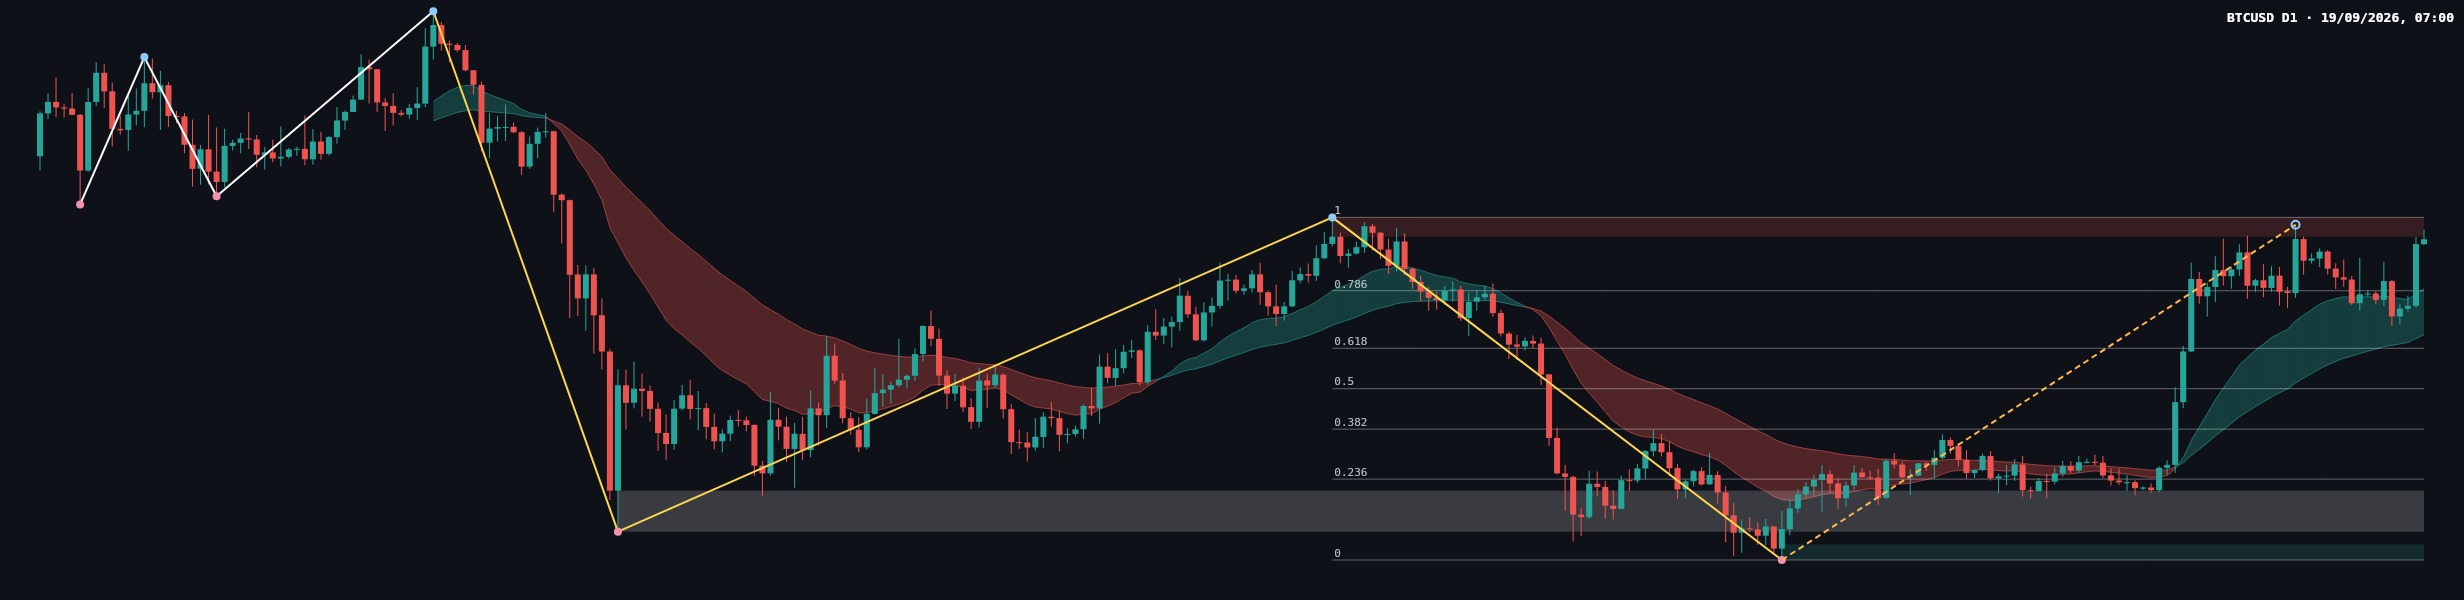
The daily frame also has a firm downtrend as its main trend and an up sub-trend. This aligns with the weekly direction at the primary-trend level, while the rising sub-trend represents a recovery within that larger bearish structure. The report records no daily structure event, so there is no confirmed break of structure or change of character to support a definitive reversal claim.
The latest daily close at 81237.55 sits just below the daily resistance zone at 81426.29–82844.58. This zone coincides with the upper endpoint of the latest completed Dow leg at 82844.58. The nearest daily support zone is the broken-retest area at 59783.75–62793.85, while the deeper daily support zone is 57704.79–58851.43. The most recent confirmed daily swing low is 57704.79.
The daily ATR is 2293.28. The Fibonacci structure runs from 57704.79 at the zero level to 82844.58 at the one level. The marked retracement levels are 63637.78 at 0.236, 67308.19 at 0.382, 70274.69 at 0.5, 73241.18 at 0.618 and 77464.66 at 0.786. The current retracement ratio is 0.936, placing price close to the upper end of that completed leg and directly beneath 82844.58.
The report does not provide numerical moving-average readings, so the exact distance between the daily averages, their slope and any crossover are not determinable from the report. Likewise, volume and momentum readings are not supplied. The chart therefore supports a price-structure assessment rather than a volume-confirmed signal.
Key levels and recent price behaviour
- 81426.29–82844.58: daily resistance and the principal test for the current upward sub-trend.
- 80538.63–84683.30: weekly broken-retest resistance, surrounding the current close and increasing the importance of rejection or acceptance.
- 94752.29–97971.19: higher weekly resistance if the market establishes itself above the nearer resistance areas.
- 59783.75–62793.85: daily broken-retest support.
- 57704.79–58851.43: deeper daily support and the area containing the most recent confirmed daily swing low.
- 59783.75–69241.82: broader weekly support.
The report does not provide candle-by-candle OHLC measurements for the latest sessions, so a precise classification of the last candle as a pin bar, engulfing candle, doji or another pattern is not determinable from the report. What can be established is its location: the close at 81237.55 is below the daily resistance zone and inside the weekly broken-retest area. That positioning leaves the market at a decision point rather than confirming either continuation or reversal.
Scenarios
Bullish continuation scenario
If daily price establishes acceptance above 82844.58, the upward sub-trend would gain structural support. A further move through the weekly resistance area at 80538.63–84683.30 would be more meaningful if it is followed by a successful retest rather than an immediate return below the zone. The next higher-timeframe resistance area to monitor would be 94752.29–97971.19. This scenario would be invalidated by a clear rejection back below 81426.29–82844.58 and renewed acceptance beneath the nearby weekly resistance structure.
Bearish rejection scenario
If price fails to clear 81426.29–82844.58 and instead returns below 80538.63, the rejection would favour continuation of the dominant weekly and daily downtrends. In that case, attention would shift toward the daily broken-retest support zone at 59783.75–62793.85, with the deeper support area at 57704.79–58851.43 providing the next broader reference. This scenario would be weakened by sustained acceptance above 82844.58.
Range and failed-break scenario
Price may remain trapped between the resistance region at 81426.29–82844.58 and the nearby weekly broken-retest boundary at 80538.63. A brief move above resistance followed by a close back below the zone would represent a failed bullish attempt; a brief move below 80538.63 followed by recovery would instead signal bearish rejection has not yet extended. The key invalidation for a range interpretation would be sustained acceptance outside these boundaries.
What to monitor
- Whether the daily close remains below or establishes acceptance above 82844.58.
- Whether the weekly broken-retest zone at 80538.63–84683.30 behaves as resistance or is reclaimed as support.
- Whether rejection pressure carries price toward 59783.75–62793.85 or the deeper zone at 57704.79–58851.43.
- Whether a move through a boundary is confirmed by a close and subsequent retest, rather than only an intraday excursion.
- Whether the broader downtrend remains intact while the sub-trend is rising.
There is no news or economic-calendar information in the supplied report. Traders should remain aware that macroeconomic releases, policy communication, currency movements, yields and geopolitical headlines can alter the behaviour of these technical zones. The chart analysis alone does not establish how such events will affect BTCUSD.
Summary
- The weekly and daily main trends are down, while the sub-trends are up.
- The close at 81237.55 is pressing against daily resistance at 81426.29–82844.58.
- The weekly broken-retest zone at 80538.63–84683.30 is the principal higher-timeframe area around current price.
- Acceptance above 82844.58 would strengthen the bullish sub-trend; rejection below 80538.63 would favour the dominant bearish structure.
- Support references remain 59783.75–62793.85 and 57704.79–58851.43.
The single most important issue is whether price can achieve sustained acceptance above 82844.58 or is rejected from the surrounding resistance structure.
This article is technical analysis and reference information only, not investment advice. Markets carry risk, and readers are responsible for their own decisions.