
BTCUSD is trading at a decision point after a recovery from the daily support area. The last closed daily price is 76355.73, while the weekly last closed price is 77254.60. Both timeframes retain a firm downtrend classification, although each also shows an upward sub-trend. The central question is whether the recovery can extend into 81426.29–82844.58 or instead lose momentum near the current Fibonacci retracement area.
Higher-timeframe context
The weekly chart defines the broader framework. Its main trend is down, with an upward sub-trend and no confirmed structure event. The most recent confirmed weekly swing is a low at 59783.75, so the current advance is best treated as a counter-trend recovery until the chart records a clear structural change.
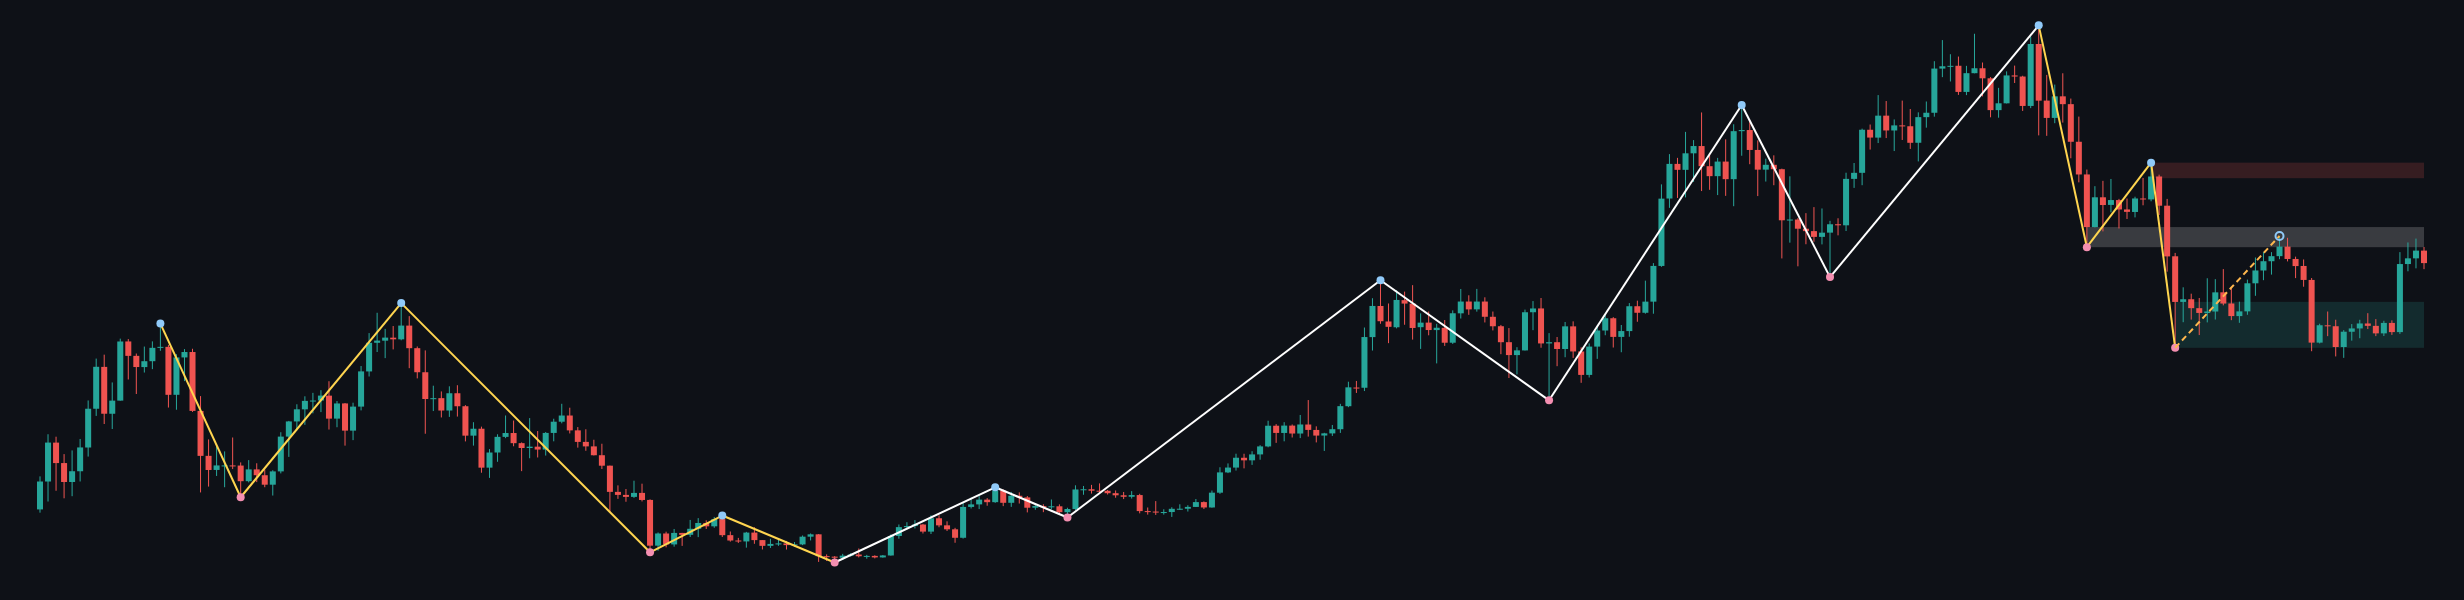
Weekly resistance is located at 94775.50–97971.19. A closer broken-retest resistance zone sits at 80538.63–84683.30. Below the market, the main weekly support zone is 59783.75–69241.82. With weekly ATR at 6391.37, movement around these zones can be substantial, and a brief penetration would not by itself confirm a lasting breakout.
The weekly picture permits further upside while the sub-trend remains intact, but it still favors caution toward resistance. A sustained move through the nearer resistance area would improve the recovery case; rejection there would preserve the dominant bearish framework.
Main-frame structure
The daily chart also has a firm downtrend with an upward sub-trend, so it aligns with the weekly direction while showing a counter-trend rally. No daily structure event is reported. The latest confirmed daily swing low is 57704.79, and the daily support zone is 57704.79–58788.66.
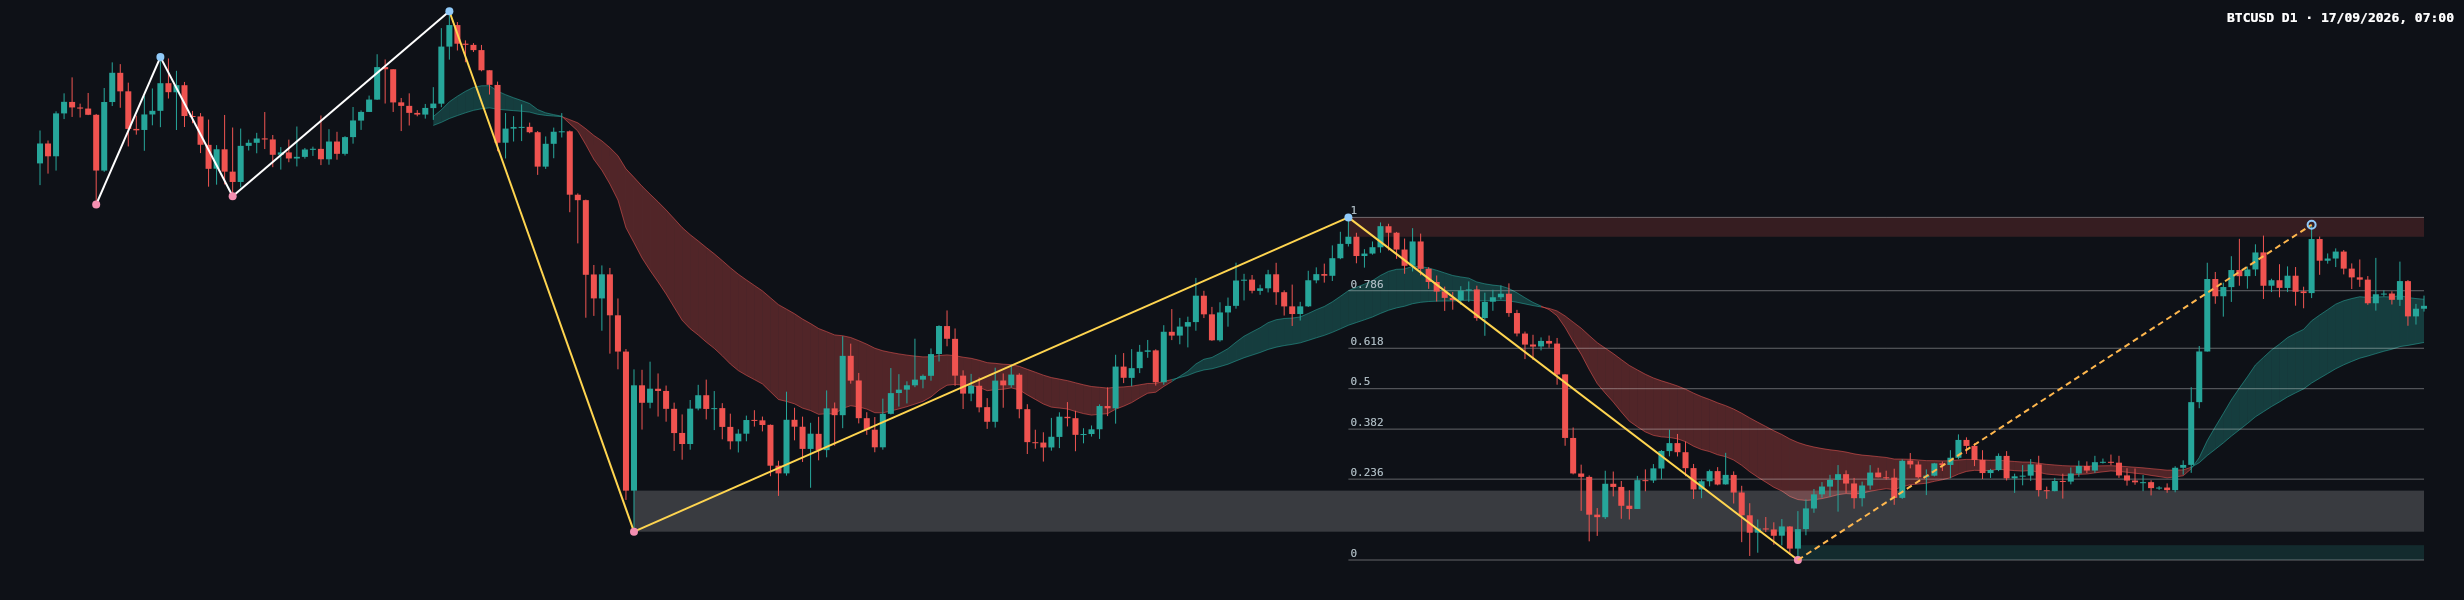
The daily resistance zone is 81426.29–82844.58. A lower broken-retest resistance area is marked at 59783.75–62793.85, which now acts as historical structure beneath price. Daily ATR is 2167.75, indicating that normal daily volatility remains meaningful around the nearby levels.
The latest completed Dow leg runs from 57704.79 at the zero point to 82844.58 at the one point. Its Fibonacci levels are 63637.78 at 0.236, 67308.19 at 0.382, 70274.69 at 0.5, 73241.18 at 0.618, and 77464.66 at 0.786. The current retracement ratio is 0.742, placing price between the 0.618 and 0.786 levels and relatively close to 77464.66.
Key levels and recent price action
- Weekly last closed price: 77254.60.
- Daily last closed price: 76355.73.
- Nearby Fibonacci reference: 77464.66, the 0.786 level.
- Daily resistance: 81426.29–82844.58.
- Weekly broken-retest resistance: 80538.63–84683.30.
- Daily broken-retest resistance: 59783.75–62793.85.
- Daily support: 57704.79–58788.66.
- Weekly support: 59783.75–69241.82.
The moving-average bands visible on the daily chart have turned upward during the recovery, but their exact values are not included in the deterministic report. Their visual position supports the existence of a short-term recovery, while the reported trend classification confirms that the larger directional bias remains down.
Recent candles show a sharp upward displacement from the lower consolidation area, followed by a pause and two-sided trade beneath the projected resistance region. The latest candles appear smaller than the impulsive recovery candles, suggesting that momentum has moderated. This is not a confirmed reversal signal: buyers have improved the short-term structure, but sellers remain relevant while price is below 81426.29–82844.58.
Scenarios
Bullish continuation
If daily price establishes acceptance above 77464.66 and continues toward 81426.29–82844.58, the recovery could extend into the main daily supply area. A move through that zone would also bring the weekly broken-retest area at 80538.63–84683.30 into focus. This scenario is invalidated by a decisive loss of 73241.18, the 0.618 Fibonacci level, because that would show that the recovery has surrendered an important retracement reference.
Bearish rejection
If price fails around 77464.66 or is rejected from 81426.29–82844.58, sellers could regain control of the daily counter-trend move. The first broader downside reference is the weekly support area at 59783.75–69241.82, with the daily support zone at 57704.79–58788.66 below it. This scenario is invalidated by sustained acceptance above 82844.58.
Range and failed-breakout scenario
Price may remain trapped between the nearby Fibonacci reference at 77464.66 and the daily resistance zone at 81426.29–82844.58. A false break on either side would favor a return toward the middle of the established structure rather than an immediate directional expansion. The range interpretation is weakened by a confirmed close beyond 82844.58 on the upside or below 73241.18 on the downside.
Conclusion
The daily recovery is constructive in the short term, but it is still occurring inside a broader firm downtrend. The most important area is 81426.29–82844.58: acceptance above it would strengthen the bullish recovery case, while rejection would keep the bearish higher-timeframe structure active. Until such confirmation appears, BTCUSD remains a market of competing signals rather than a confirmed trend reversal.
#BTCUSD #Bitcoin #TechnicalAnalysis #PriceAction #DowTheory
Meta description: BTCUSD daily analysis covering the recovery, Fibonacci structure, resistance at 81426.29–82844.58, support, and bullish or bearish scenarios.
This article is technical analysis and reference information only, not investment advice. Markets carry risk, and readers are responsible for their own decisions.