
BTCUSD is attempting to extend a shorter-term recovery, but the broader structure remains bearish on both the weekly and daily charts. The daily close is 80271.32, while the weekly context frame records a last closed price of 77057.88. The most important feature is the approach toward daily resistance at 81426.29–82844.58, where a confirmed reaction could determine whether the recovery develops further or loses momentum.
| Metric | Value |
|---|---|
| Weekly last closed price | 77057.88 |
| Daily last closed price | 80271.32 |
| Weekly trend | Down, firm; sub-trend up |
| Daily trend | Down, firm; sub-trend up |
| Daily resistance | 81426.29–82844.58 |
| Daily support | 57704.79–58862.47 |
| Active Fibonacci retracement | 0.898 |
Higher-timeframe context
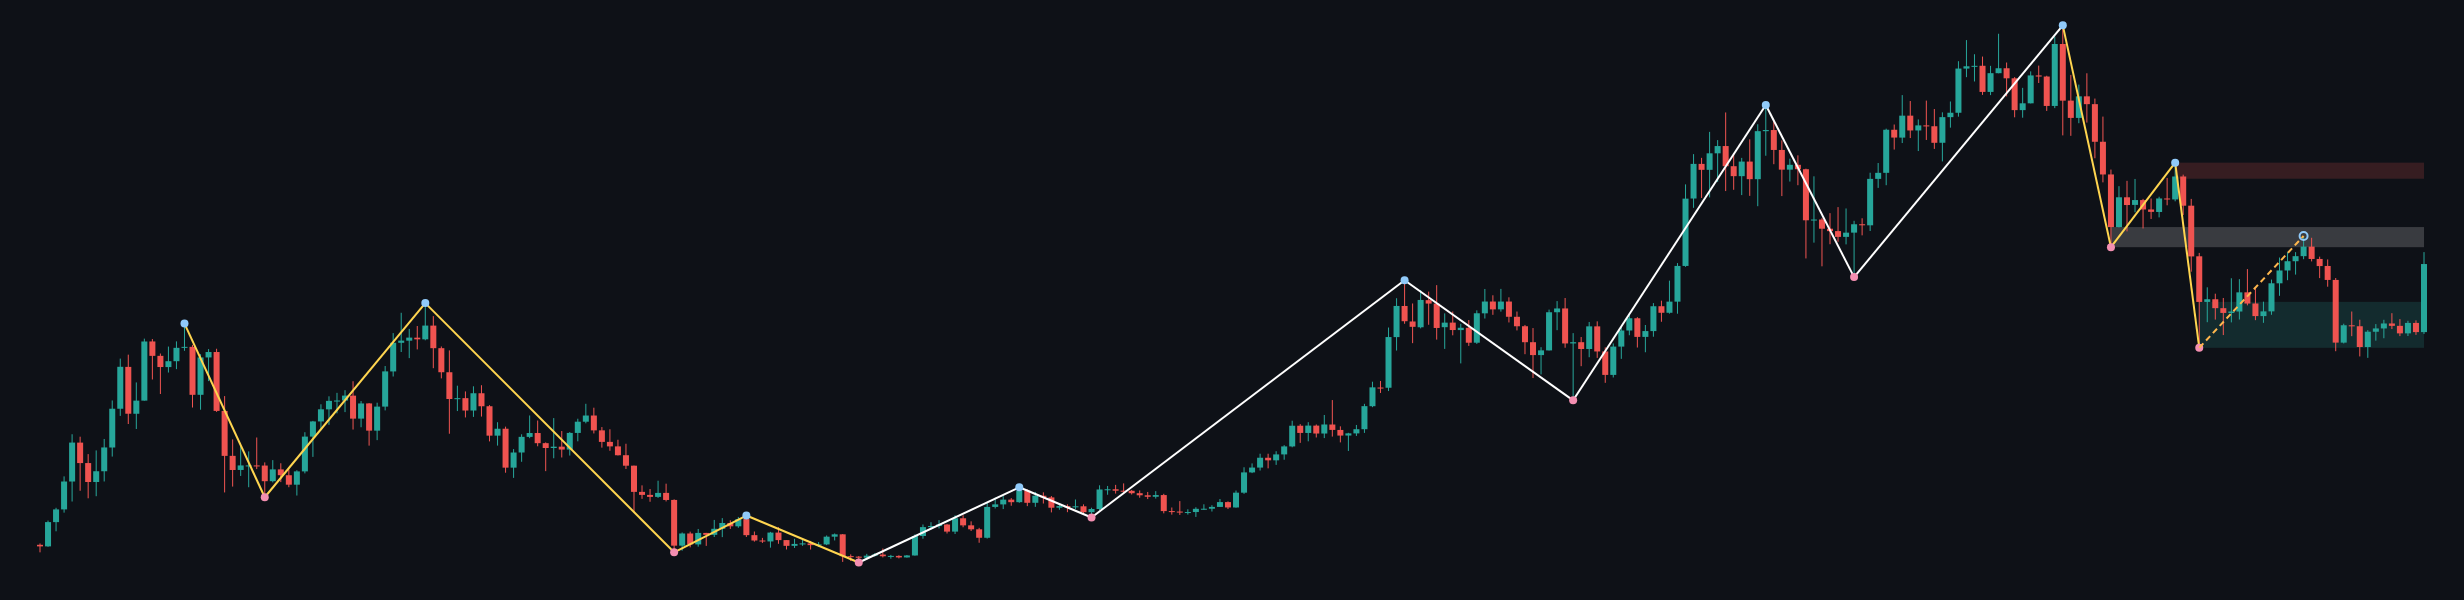
The weekly chart defines the main framework as a firm downtrend, despite an upward sub-trend. No structure event is reported. The most recent confirmed weekly swing is a low at 59783.75, so the current advance should be treated as a recovery within a larger bearish structure until the chart records a clear structural change.
Price is approaching the weekly broken-retest resistance zone at 80538.63–84683.30. This area overlaps the upper portion of the daily resistance zone at 81426.29–82844.58, making the overlap particularly important. A sustained move through this combined resistance would improve the bullish case, while rejection would preserve the higher-timeframe bearish interpretation.
The broader weekly resistance zone is 94666.07–97971.19. The major weekly support zone is 59783.75–69241.82. Weekly ATR is 6610.23, indicating that the higher-timeframe range remains substantial. The weekly chart therefore permits continued recovery, but it does not yet establish a confirmed reversal.
Main-frame structure
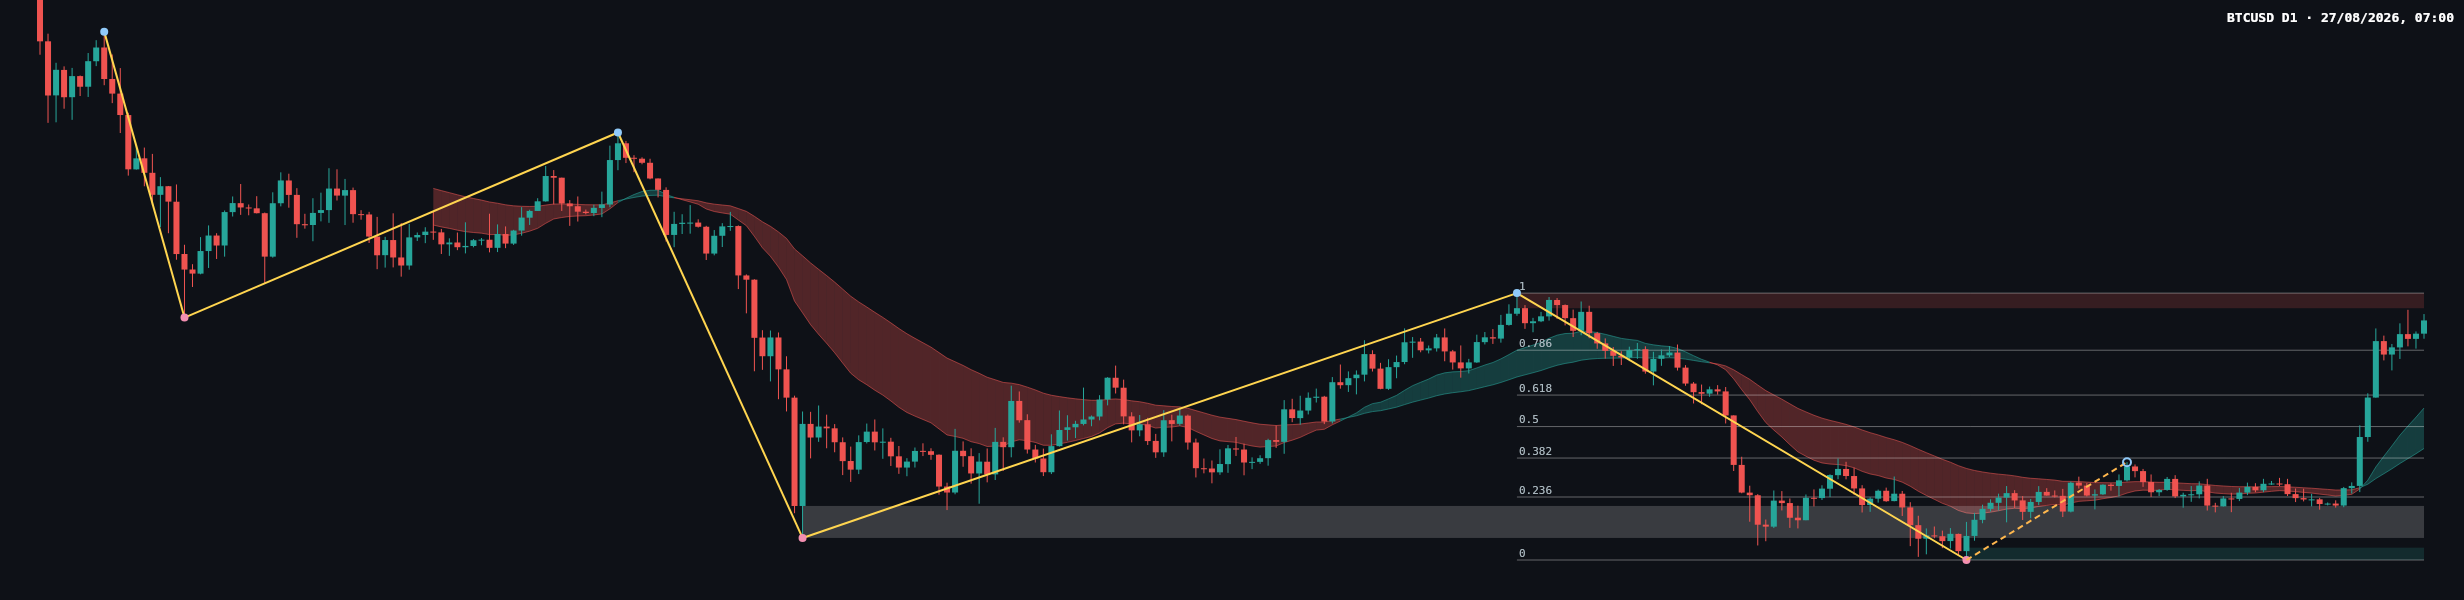
The daily chart also shows a firm downtrend with an upward sub-trend, so the daily and weekly frameworks are aligned. The advance from the confirmed daily swing low at 57704.79 represents a counter-trend recovery unless a new bullish structure event develops. No BOS or CHoCH is reported.
The daily broken-retest resistance zone at 59783.75–62793.85 is well below the current close and is therefore not the immediate decision area. The nearer resistance is 81426.29–82844.58, with 82844.58 also marking the upper endpoint of the latest completed Fibonacci leg.
The daily support zone is 57704.79–58862.47. Daily ATR is 2315.36. The chart shows a strong rebound from the lower consolidation area and a move back above the intermediate Fibonacci references, but the current retracement ratio of 0.898 indicates that price has recovered most of the latest measured decline. That places greater emphasis on the resistance response rather than on the existence of the rebound alone.
Key levels and Fibonacci map
- 81426.29–82844.58: immediate daily resistance and the main bullish-versus-bearish decision zone.
- 80538.63–84683.30: weekly broken-retest resistance, overlapping the daily resistance area.
- 77464.66: Fibonacci 0.786 reference below the daily close.
- 73241.18: Fibonacci 0.618 reference.
- 70274.69: Fibonacci 0.5 reference.
- 67308.19: Fibonacci 0.382 reference.
- 63637.78: Fibonacci 0.236 reference.
- 59783.75–62793.85: daily broken-retest resistance, now below the current market.
- 57704.79–58862.47: daily support and the location of the most recent confirmed daily low.
The Fibonacci leg runs from 57704.79 at 0 to 82844.58 at 1. With the current retracement ratio at 0.898, price is close to the upper boundary of that measured move. The Fibonacci structure remains useful as a map, but the reaction at resistance will determine whether the recovery is accepted or rejected.
Scenarios
Primary scenario: rejection from resistance
If price fails to secure acceptance above 81426.29–82844.58, the recovery may lose momentum and revert toward the lower Fibonacci references, beginning with 77464.66. The bearish interpretation is invalidated by a confirmed daily break and sustained acceptance above 82844.58. This is the higher-probability scenario while both the weekly and daily main trends remain firmly down, although no numerical probability is assigned because the report provides no probability model.
Secondary scenario: bullish continuation
If price breaks and holds above 81426.29–82844.58, the recovery would gain technical confirmation against the immediate daily resistance. The next higher-timeframe reference is the weekly resistance zone at 80538.63–84683.30, which overlaps the breakout area; the broader overhead supply is 94666.07–97971.19. The bullish continuation scenario is invalidated if price returns below 81426.29 after failing to hold the resistance break.
Risk scenario: deeper retracement
If rejection develops and price loses 77464.66, the retracement could extend toward 73241.18, 70274.69, or 67308.19. A more severe decline would bring the support areas at 59783.75–62793.85 and 57704.79–58862.47 back into focus. This scenario is weakened by sustained acceptance above 77464.66 and invalidated as a downside extension if price establishes itself above 82844.58.
Reading the latest daily candle
The supplied report does not classify the latest candle by body, wick, or range, so a precise label such as pin bar, engulfing candle, or doji is not determinable from the report. The chart does show a sharp recovery into the current close of 80271.32, but the practical interpretation still depends on whether the next daily candles confirm acceptance above 81426.29–82844.58 or show rejection from that zone.
EMA values, their exact spacing, crossover status, and volume or momentum readings are not determinable from the deterministic report. These omissions mean that price structure and the stated support, resistance, ATR, and Fibonacci references should carry the analysis.
Key considerations
- Watch the daily resistance at 81426.29–82844.58 and the weekly broken-retest zone at 80538.63–84683.30.
- Monitor 77464.66 as the nearest stated Fibonacci reference below the daily close.
- A daily close above 82844.58 would provide stronger evidence of bullish continuation; rejection below the resistance zone would favor the bearish framework.
- A loss of 77464.66 would expose the lower Fibonacci references, while the broader support areas remain 59783.75–62793.85 and 57704.79–58862.47.
- No news or economic-calendar context was supplied. Traders should account for event-driven volatility rather than assume that technical levels will hold cleanly.
Summary
- The weekly and daily main trends are both down and firm, while their sub-trends are up.
- The daily close is 80271.32, approaching resistance at 81426.29–82844.58.
- The weekly broken-retest zone at 80538.63–84683.30 reinforces the importance of the current area.
- A confirmed break above 82844.58 would strengthen the recovery case; rejection could redirect attention toward 77464.66 and lower Fibonacci references.
The single most important consideration is whether BTCUSD is accepted above or rejected from 81426.29–82844.58.
This article is technical analysis and reference information only, not investment advice. Markets carry risk, and readers are responsible for their own decisions.
#BTCUSD #Bitcoin #TechnicalAnalysis #PriceAction #MarketOutlook
BTCUSD daily analysis: a firm broader downtrend meets rising sub-trend momentum near 81426.29–82844.58 resistance.