
BTCUSD is rebounding within a broader corrective structure. The main-frame last closed price is 78980.84, while the higher-timeframe close is 77057.88. Both frames retain a firm downtrend with an upward sub-trend, making the 81426.29–82844.58 resistance zone the central area for assessing whether the recovery can develop into a larger structural change or instead meet renewed selling.
Higher-timeframe context
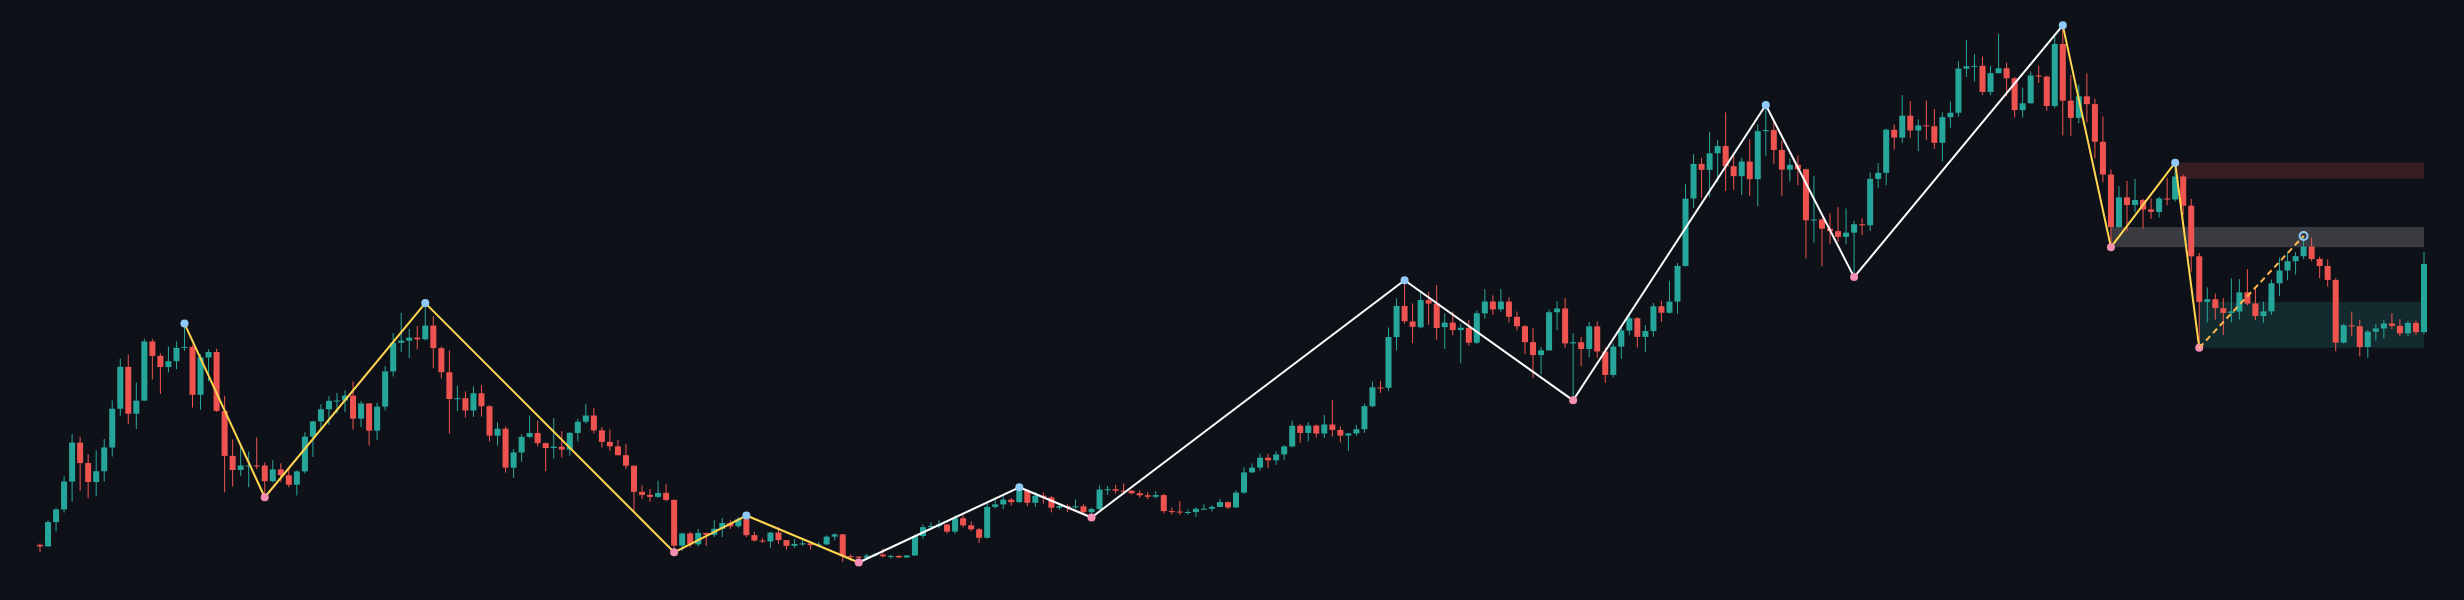
The weekly framework remains down, with the sub-trend currently up and no confirmed structure event reported. The most recent confirmed weekly swing is a low at 59783.75. This combination describes a recovery inside a broader bearish structure rather than a confirmed trend reversal.
Above the higher-timeframe close at 77057.88, the broken-retest resistance zone at 80538.63–84683.30 is the first important area. A higher supply zone is located at 94666.07–97971.19. Below price, the broader support zone is 59783.75–69241.82. The weekly ATR is 6610.23, so movement around these zones can be substantial even without a confirmed structure break.
The weekly report does not provide a separate Fibonacci study or EMA readings. The available evidence therefore favors treating the present rise as a permitted counter-trend recovery while the larger downtrend remains intact until a confirmed structure event develops.
Main-frame structure
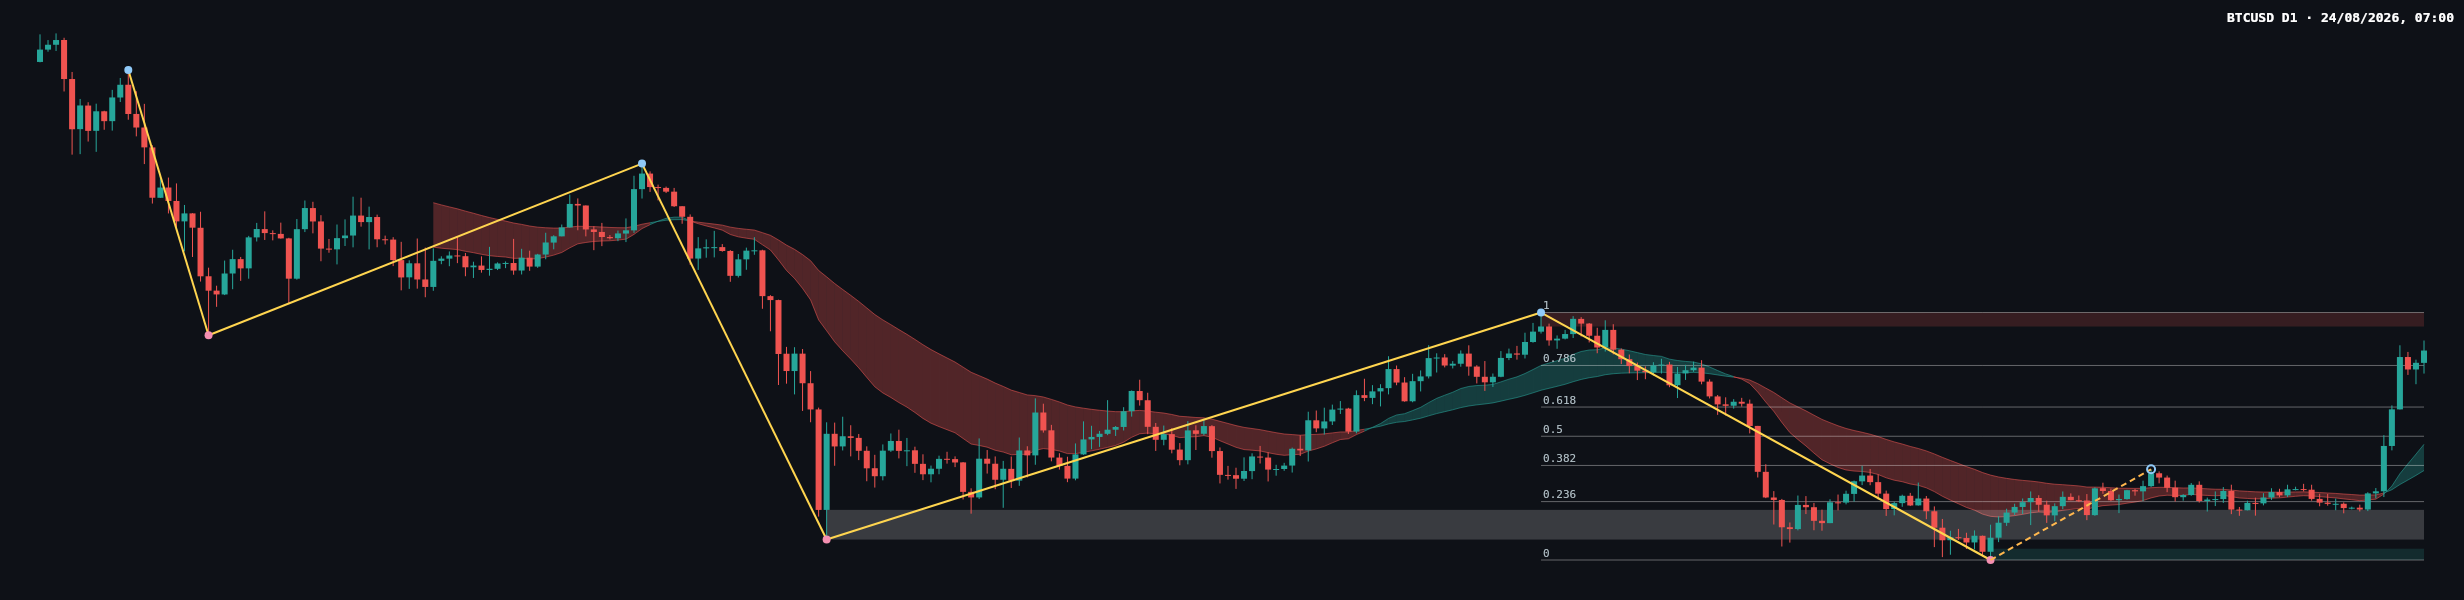
The daily frame also shows a firm downtrend with an upward sub-trend and no reported BOS or CHoCH. This aligns with the weekly picture: buyers have improved the short-term path, but the available structure data does not yet confirm a lasting reversal.
The latest daily close at 78980.84 is above the 0.786 Fibonacci level at 77464.66 and below the latest completed leg’s upper reference at 82844.58. The daily resistance zone is 81426.29–82844.58. The daily support zone is 57704.79–58847.83, while the broken-retest resistance area at 59783.75–62793.85 is much lower and would become relevant if the recovery failed broadly.
The daily ATR is 2286.08. No EMA values, volume readings, or momentum measurements are included in the deterministic report, so their slope, spacing, crossover status, and confirmation cannot be determined from the supplied data.
Key levels and Fibonacci map
| Area | Level or zone | Role |
|---|---|---|
| Current daily close | 78980.84 | Reference point for the main frame |
| Near daily resistance | 81426.29–82844.58 | Decision zone above price |
| Weekly broken-retest resistance | 80538.63–84683.30 | Higher-timeframe overhead area |
| Higher supply | 94666.07–97971.19 | Potential extension area if resistance gives way |
| Fibonacci reference | 0.786 at 77464.66 | Current recovery reference |
| Lower Fibonacci references | 0.618 at 73241.18; 0.5 at 70274.69 | Potential retracement areas |
| Weekly support | 59783.75–69241.82 | Broader demand region |
| Daily support | 57704.79–58847.83 | Lower confirmed support zone |
The reported current retracement ratio is 0.846. This places the recovery beyond the listed 0.786 level at 77464.66, but the price remains below 82844.58, the upper endpoint of the latest completed Fibonacci leg.
Recent price action
The most recent visible daily action shows a sharp upward response from the lower consolidation area, followed by a sequence of bullish candles carrying price back toward the resistance band. The latest candle closes at 78980.84, in the upper portion of the recent rebound, which indicates that buyers controlled the latest visible advance.
However, the report does not provide the candle’s exact open, high, low, or range. A precise classification such as Marubozu, pin bar, engulfing candle, or inside bar is therefore not determinable from the deterministic data. The price reaction is constructive above 77464.66, but the absence of a reported structure event means the move is still best treated as a recovery rather than confirmed trend change.
Scenarios
Bullish continuation
If BTCUSD establishes acceptance above the 81426.29–82844.58 resistance zone, the recovery would have room to challenge the higher-timeframe supply area at 94666.07–97971.19. A return below 77464.66 would weaken this interpretation, while a move back through the resistance zone without acceptance would raise the risk of a failed breakout. Probability percentages are not supplied by the report and are therefore not assigned.
Bearish rejection
If price is rejected within 81426.29–82844.58, especially after failing to hold above 80538.63, the daily recovery could rotate back toward 77464.66 and then the 73241.18–70274.69 Fibonacci region. Sustained acceptance above 82844.58 would invalidate this rejection interpretation.
Deeper corrective move
If selling returns and price loses the 73241.18–70274.69 area, attention would shift toward the broader weekly support zone at 59783.75–69241.82, with the daily support zone at 57704.79–58847.83 below it. A recovery back above 77464.66 would weaken the deeper-correction scenario.
What to monitor
- Whether price can hold above 77464.66 while approaching 81426.29–82844.58.
- Whether a daily close above 82844.58 is followed by acceptance rather than an immediate rejection.
- Whether rejection from resistance produces a lower high and a move toward 73241.18 or 70274.69.
- Whether the broader support region at 59783.75–69241.82 remains defended if the recovery fails.
The cleanest confirmation would come from price behavior around the stated zones: acceptance above resistance would support continuation, while rejection and a loss of the Fibonacci recovery reference would favor a corrective interpretation. Volume, momentum, EMA behavior, news timing, and session-specific conditions are not available in the deterministic report and should not be inferred here.
Closing view
BTCUSD’s daily recovery is technically constructive above 77464.66, but both the weekly and daily main trends remain firmly down and no structure event has been reported. The key test is the overlap between the daily resistance zone at 81426.29–82844.58 and the higher-timeframe broken-retest area at 80538.63–84683.30; acceptance would improve the bullish case, while rejection would keep the broader bearish framework dominant.
#BTCUSD #Bitcoin #PriceAction #TechnicalAnalysis #Fibonacci
Meta description: BTCUSD remains in a firm downtrend while its daily recovery approaches 81426.29–82844.58 resistance.
This article is technical analysis and reference information only, not investment advice. Markets carry risk, and readers are responsible for their own decisions.