
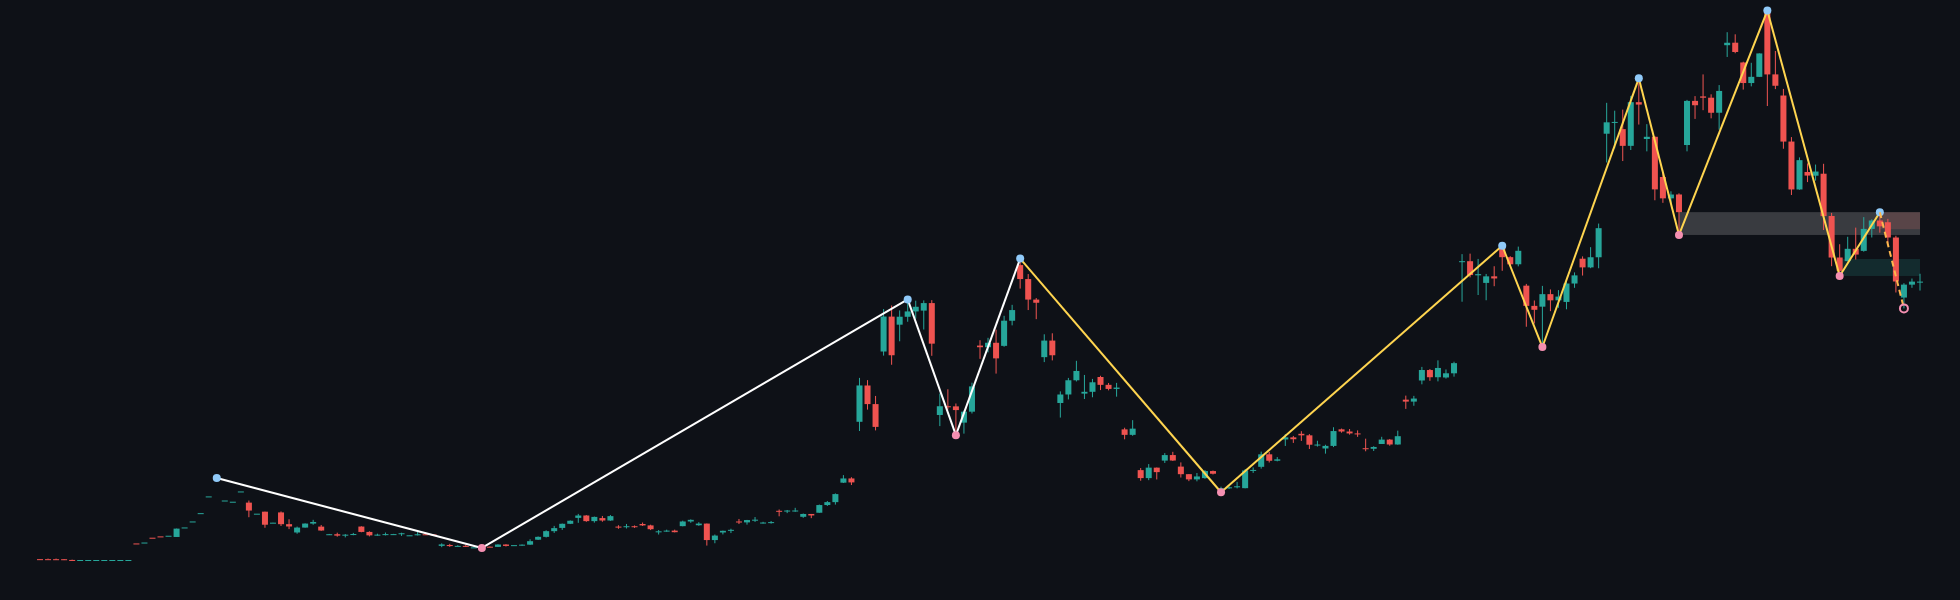
BTCUSD remains under pressure in the higher-timeframe structure. The latest weekly close is 63776.82, while the latest daily close is 62979.18. The weekly trend is firmly down, and the daily chart shows a firmly down main trend with an upward sub-trend, placing the current move in the context of a counter-trend rebound rather than a confirmed reversal.
Higher-timeframe context
The weekly chart has a firm downtrend and a down sub-trend. A bearish break of structure occurred at 65062.28, and the most recent confirmed swing is a high at 79513.01. The latest weekly close at 63776.82 is below the weekly support zone at 65062.28–68904.65, so that former support area is now an important overhead reference.
Above the current price, the broader weekly resistance zones are 75670.64–79513.01 and 74364.56–79533.38. The latter is marked as a broken-retest area. The weekly ATR is 7684.74, indicating that the larger timeframe has materially wider price movement than the daily frame.
The weekly chart therefore permits a corrective recovery, but it does not yet establish a bullish structural change. A sustained recovery through 68904.65 would improve the higher-timeframe picture; failure beneath the former support zone would keep the bearish framework dominant.
Main-frame structure
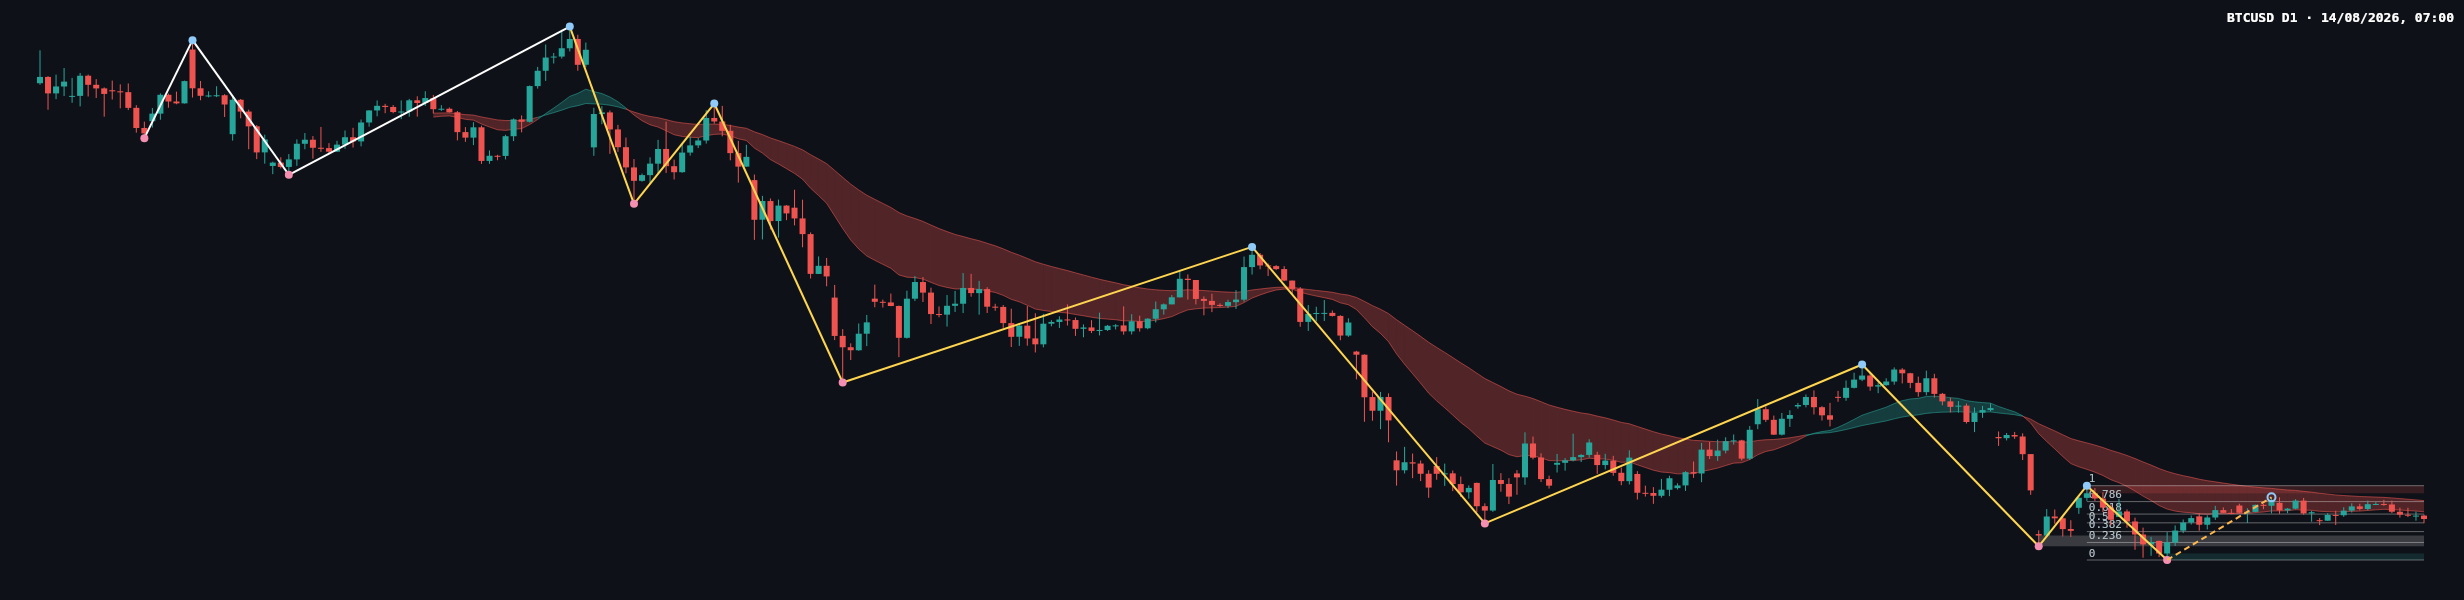
The daily main trend remains firmly down, while the sub-trend is up. This is a clear timeframe disagreement: the daily rebound is moving against the weekly direction, so it may represent a pullback within the broader decline unless resistance is reclaimed and held.
The daily resistance zone is 66281.39–67264.32. The daily support zone is 57704.79–58541.32, with the most recent confirmed swing low at 57704.79. Another important area is the broken-retest resistance zone at 59472.70–60849.22. Since the latest close at 62979.18 is above that zone but below 66281.39, the market is currently positioned between former resistance and the next larger supply area.
No daily break of structure is reported. That absence matters: the upward sub-trend has not yet produced a confirmed bullish structure event. The daily ATR is 1400.87, so movement around the nearby Fibonacci references may remain substantial without necessarily changing the broader trend.
Key levels and Fibonacci map
| Reference | Level or zone | Technical role |
|---|---|---|
| Weekly broken structure | 65062.28 | Weekly bearish break reference and lower edge of former support |
| Daily resistance | 66281.39–67264.32 | Primary overhead supply zone |
| Daily broken-retest resistance | 59472.70–60849.22 | Former resistance and potential reaction area |
| Daily support | 57704.79–58541.32 | Major downside demand zone |
| Fibonacci midpoint | 62484.56 | Important pivot beneath the latest daily close |
| Fibonacci retracement | 0.552 | Current retracement position |
The latest completed daily Dow leg runs from 57704.79 to 67264.32. Its Fibonacci references are 59960.84 at 0.236, 61356.53 at 0.382, 62484.56 at 0.5, 63612.58 at 0.618, and 65218.58 at 0.786. With the current retracement ratio at 0.552, price is between the 0.5 and 0.618 references. The latest close at 62979.18 is above 62484.56 but below 63612.58, leaving both levels relevant to the next directional test.
Scenarios
Bullish continuation scenario
If price can reclaim and sustain trade above 63612.58, the daily rebound would gain technical support from the Fibonacci structure. A move toward 65218.58 would then bring price closer to the daily resistance zone at 66281.39–67264.32. This scenario is invalidated if price loses 62484.56 and cannot recover it, because that would weaken the current upward sub-trend.
Range and consolidation scenario
Price may continue to rotate between 62484.56 and 63612.58 while the market decides whether the daily rebound can extend. Repeated rejection near 63612.58 would show that sellers remain active beneath the upper Fibonacci band, while holding above 62484.56 would preserve the corrective structure. This scenario is invalidated by a decisive move outside those references.
Bearish continuation scenario
If price breaks below 62484.56, sellers would regain control of the immediate Fibonacci pivot. The next downside references are 61356.53, 59960.84, and the broken-retest zone at 59472.70–60849.22. A deeper decline would place the daily support zone at 57704.79–58541.32 back into focus. This scenario is invalidated by a sustained recovery above 63612.58.
On balance, the higher-probability directional framework remains bearish because both primary trends are down, although the daily sub-trend favors a corrective recovery. The key question is whether price holds 62484.56 and reclaims 63612.58, or instead loses the midpoint and resumes movement toward the lower Fibonacci references.
What to monitor
- Watch 63612.58 and 65218.58 as recovery references, followed by the resistance zone at 66281.39–67264.32.
- Watch 62484.56 as the immediate Fibonacci pivot, with 61356.53, 59960.84, and 57704.79–58541.32 below.
- A bullish interpretation requires acceptance above the relevant resistance references rather than a brief intraday probe.
- A bearish interpretation strengthens if price loses 62484.56 and then fails to reclaim it.
- False breakouts and volatility around scheduled economic news can produce temporary moves through these zones, so confirmation is more informative than a single price spike.
Summary
- The weekly trend is firmly down, with a bearish structure break at 65062.28.
- The daily main trend is also firmly down, but its sub-trend is up.
- Price is above the Fibonacci midpoint at 62484.56 and below the 0.618 reference at 63612.58.
- The principal daily resistance zone is 66281.39–67264.32.
- The single most important issue is whether 62484.56 holds while price tests 63612.58.
#BTCUSD #Bitcoin #TechnicalAnalysis #PriceAction #DowTheory
Meta description: BTCUSD remains in a firm downtrend as the daily rebound tests Fibonacci resistance between 62484.56 and 63612.58.
This article is technical analysis and reference information only, not investment advice. Markets carry risk, and readers are responsible for their own decisions.