
BTCUSD presents a mixed multi-timeframe picture. The weekly structure is sideways with a firm range and an upward sub-trend, while the daily trend remains firmly down despite a shorter-term upward sub-trend. The daily closing price is 63405.82, just above the broken-retest resistance zone at 59783.75–62793.85; the weekly closing price is 64910.12, still within the broader weekly support zone at 59783.75–69241.82.
Higher-timeframe context
The weekly chart defines the broader environment as sideways, with an upward sub-trend and no confirmed structure event. The most recent confirmed weekly swing is a low at 59783.75. This keeps the market above an important structural reference, but the range-bound classification means the upward sub-trend has not yet become a confirmed broader trend.
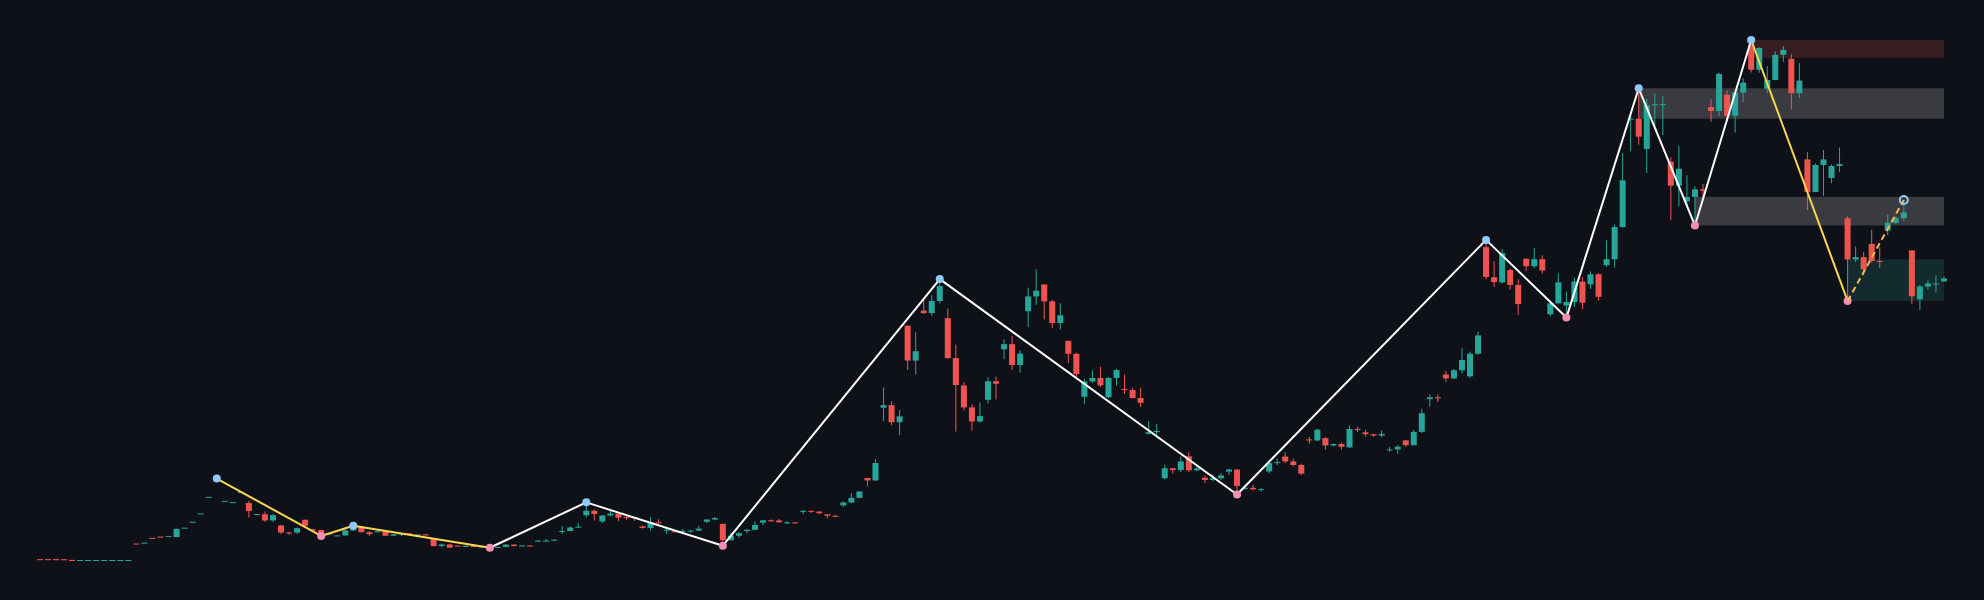
The main weekly support zone is 59783.75–69241.82. A separate broken-retest support zone is located at 101400.28–108329.52, while the broken-retest resistance zone is at 77025.31–83539.79. Higher resistance is marked at 115263.98–119361.53. With the weekly close at 64910.12, price is positioned inside the broad support area rather than pressed against the higher resistance zones.
Weekly EMA values and their exact position relative to price are not determinable from the deterministic report. The weekly ATR is 8195.10, indicating that the broader market has materially wider movement potential than the daily ATR of 1492.91.
Weekly conclusion: The higher timeframe permits a continuation of the upward sub-trend while price holds the 59783.75–69241.82 support zone. However, the sideways classification argues for confirmation before treating any advance as a durable structural change.
Main-frame structure
The daily chart remains in a firm downtrend, while its sub-trend is up. This is not fully aligned with the weekly picture: the daily recovery is consistent with a countertrend advance inside a larger daily decline, although sustained acceptance above the relevant resistance area would improve the reversal case.
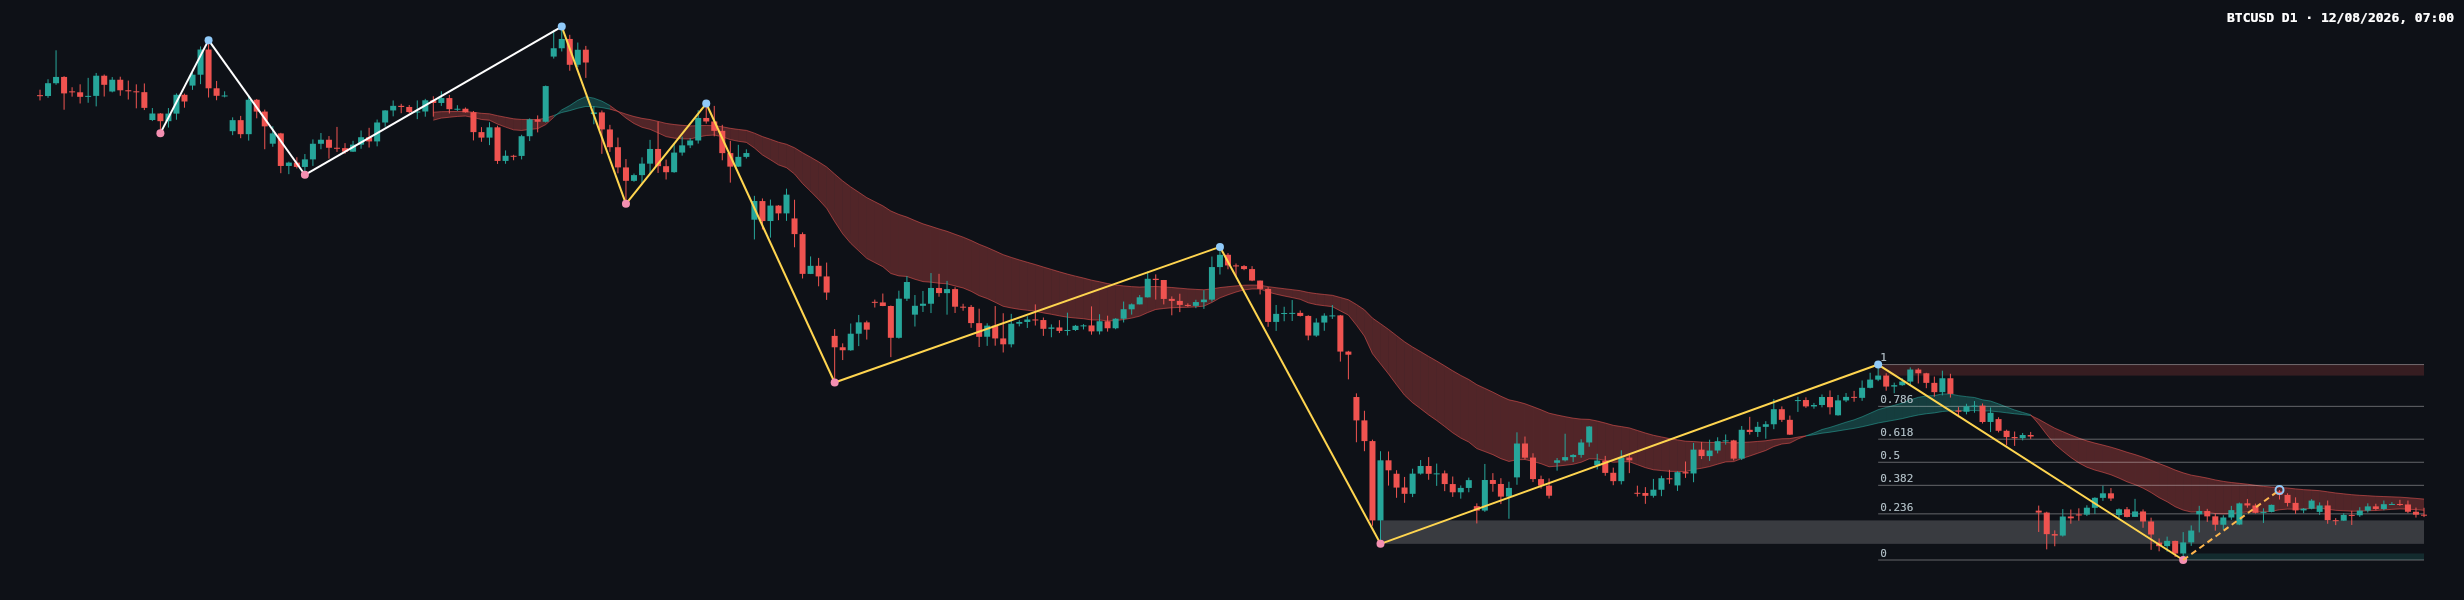
The most recent confirmed daily swing is a low at 57704.79. The daily report identifies no structure event, so there is no confirmed BOS or CHoCH to establish a completed reversal. The primary daily resistance zone is 81426.29–82844.58, while the principal support zone is 57704.79–58541.32. The broken-retest resistance zone at 59783.75–62793.85 is currently the closest structural area to the daily close of 63405.82.
Daily EMA values, their slope, spacing, and any crossover are not determinable from the deterministic report. The chart shows moving-average bands, but no permitted numerical values are supplied for them. The current retracement ratio is 0.227, placing attention on the Fibonacci reference at 63637.78, which is the 0.236 level.
Key levels and recent price behaviour
The latest completed daily Dow leg is mapped from 57704.79 to 82844.58. Its Fibonacci references are 63637.78 at 0.236, 67308.19 at 0.382, 70274.69 at 0.5, 73241.18 at 0.618, and 77464.66 at 0.786. The current retracement ratio of 0.227 is just below the 0.236 reference, so the reaction around 63637.78 is technically important.
The most recent candles on the chart show a recovery from the daily swing low at 57704.79, followed by consolidation around the broken-retest zone. The candle sequence does not provide a confirmed structure event in the report. Exact candle classifications, individual ranges, and volume or momentum readings are not determinable from the deterministic data.
The latest daily close at 63405.82 is above the upper boundary of the broken-retest zone at 62793.85, but remains close to the Fibonacci reference at 63637.78. This leaves the market at a decision point: continued acceptance above the former resistance would support the recovery scenario, while rejection back through the zone would reinforce the prevailing daily downtrend.
Scenarios
Bullish scenario
If BTCUSD holds above 59783.75–62793.85 and establishes acceptance above 63637.78, the recovery could extend toward the next Fibonacci references at 67308.19 and 70274.69. The scenario would be invalidated by a sustained return below 59783.75–62793.85.
Bearish scenario
If price is rejected around 63637.78 and falls back through 59783.75–62793.85, sellers would regain control of the broken-retest area. A continuation toward the daily support zone at 57704.79–58541.32 would then become the relevant downside scenario. The scenario would be invalidated by sustained acceptance above 63637.78 and a recovery that holds beyond the retest zone.
Range scenario
If price remains between the daily support zone at 57704.79–58541.32 and the Fibonacci and retest references around 63637.78 and 59783.75–62793.85, the market may continue to consolidate without producing a confirmed directional signal. This scenario is weakened by a decisive move beyond either boundary.
Estimated scenario probabilities are not assigned because the deterministic report supplies no probability values. The daily bias leans cautiously bearish while price remains below the higher Fibonacci references, but the weekly support context keeps the bullish recovery scenario technically valid.
What to monitor
- Resistance: 63637.78, followed by 67308.19, 70274.69, and the daily resistance zone at 81426.29–82844.58.
- Support: 59783.75–62793.85 as the broken-retest area, followed by 57704.79–58541.32.
- Weekly context: the broader support zone at 59783.75–69241.82 remains central to the higher-timeframe interpretation.
- Confirmation: acceptance above 63637.78 would improve the recovery case, while renewed trading below 59783.75–62793.85 would favour continuation of the daily bearish structure.
Traders should remain alert to false breaks around the retest zone and to volatility around major market events. No news or economic-calendar information is provided in the report, so any fundamental catalyst and its timing are not determinable here. General risk principles remain relevant: avoid treating a single candle as confirmation, account for the daily ATR of 1492.91, and keep decisions consistent with personal risk limits.
Summary
- The weekly market is sideways with an upward sub-trend and no confirmed structure event.
- The daily trend is firmly down, although the sub-trend is up.
- The daily close of 63405.82 is near the Fibonacci reference at 63637.78.
- The broken-retest zone at 59783.75–62793.85 is the main decision area.
- A hold above the zone supports recovery scenarios; rejection through it keeps the daily bearish structure active.
The single most important factor is whether price can maintain acceptance above 59783.75–62793.85 while holding above 63637.78.
SEO meta description: BTCUSD daily analysis covering the 59783.75–62793.85 retest zone, Fibonacci levels, weekly context, and bullish or bearish scenarios.
#BTCUSD #Bitcoin #TechnicalAnalysis #PriceAction #DowTheory
This article is technical analysis and reference information only, not investment advice. Markets carry risk, and readers are responsible for their own decisions.