
BTCUSD is trading at 63534.55 on the main timeframe, above the daily broken-retest resistance zone at 59783.75–62793.85 but below the broader resistance area at 81426.29–82844.58. The higher-timeframe picture is more balanced: weekly conditions are sideways with an upward sub-trend, while the daily trend remains firmly down. The most notable feature is the market's attempt to hold above the former daily resistance area without yet producing a confirmed structure event.
Higher-timeframe context
The weekly trend is classified as sideways, with the sub-trend pointing up. The latest confirmed weekly swing is a low at 59783.75, and no weekly structure event has been recorded. This keeps the larger picture from qualifying as a confirmed bullish reversal, but it also means the weekly framework still permits a recovery while price holds above the support zone at 59783.75–69241.82.
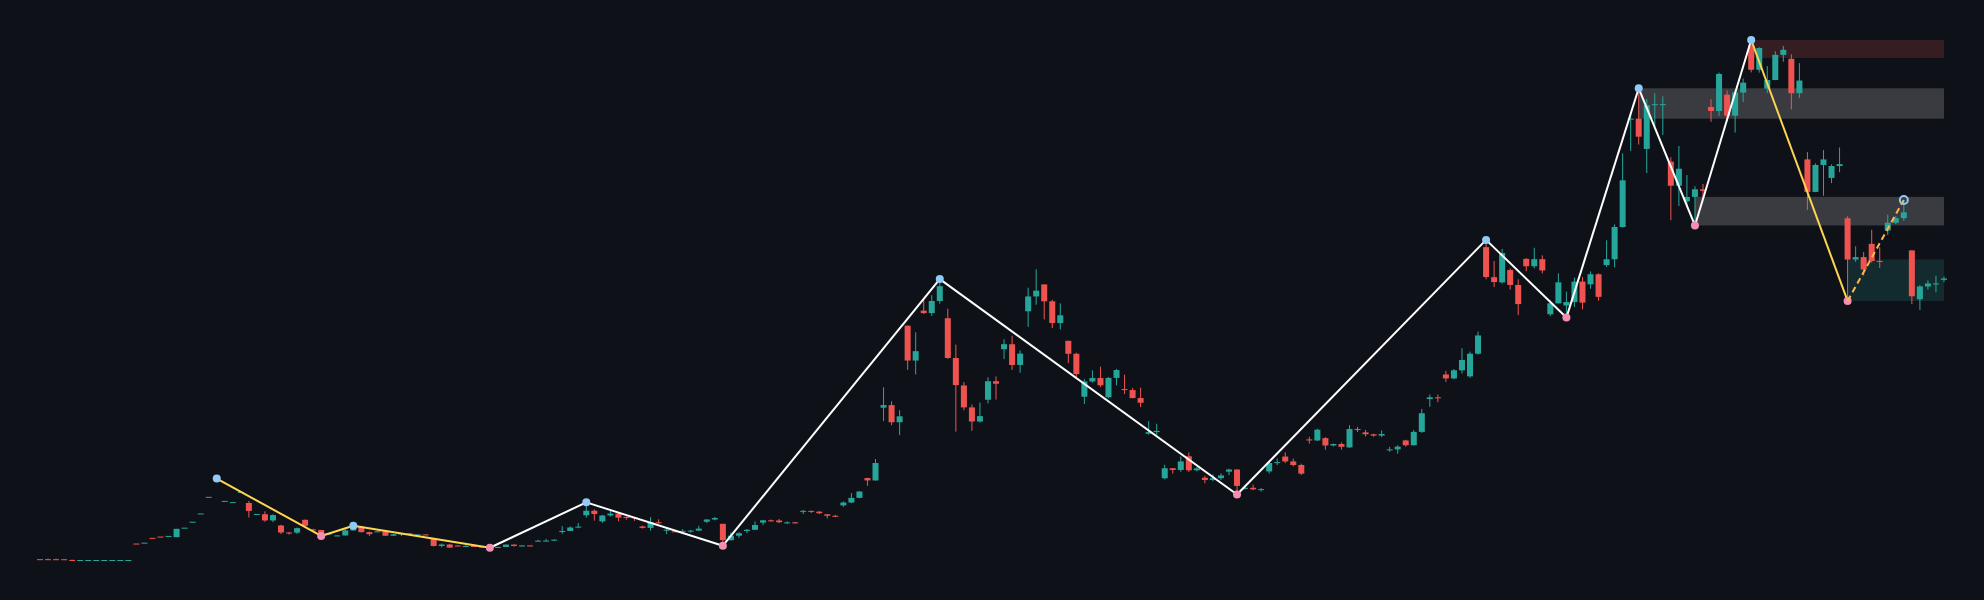
Above the market, the weekly resistance zone at 77025.31–83539.79 is marked as a broken-retest area, while the more distant resistance zone is 115263.98–119361.53. A further weekly broken-retest support zone is located at 101400.28–108329.52. These zones frame a broad range rather than a clean directional trend. Weekly ATR is 8195.10, so the distance between major zones is material relative to typical weekly movement.
From the weekly perspective, the key question is whether the support zone at 59783.75–69241.82 continues to contain selling. Holding that area would preserve the upward sub-trend and allow a test of 77025.31–83539.79. A sustained loss of the support zone would weaken that constructive interpretation.
Main-frame structure
The daily trend remains down, although its sub-trend is up. This is a misalignment with the weekly framework: the daily recovery can be read as a counter-trend advance or an early attempt to reverse the larger decline, but no confirmed daily structure event is listed.
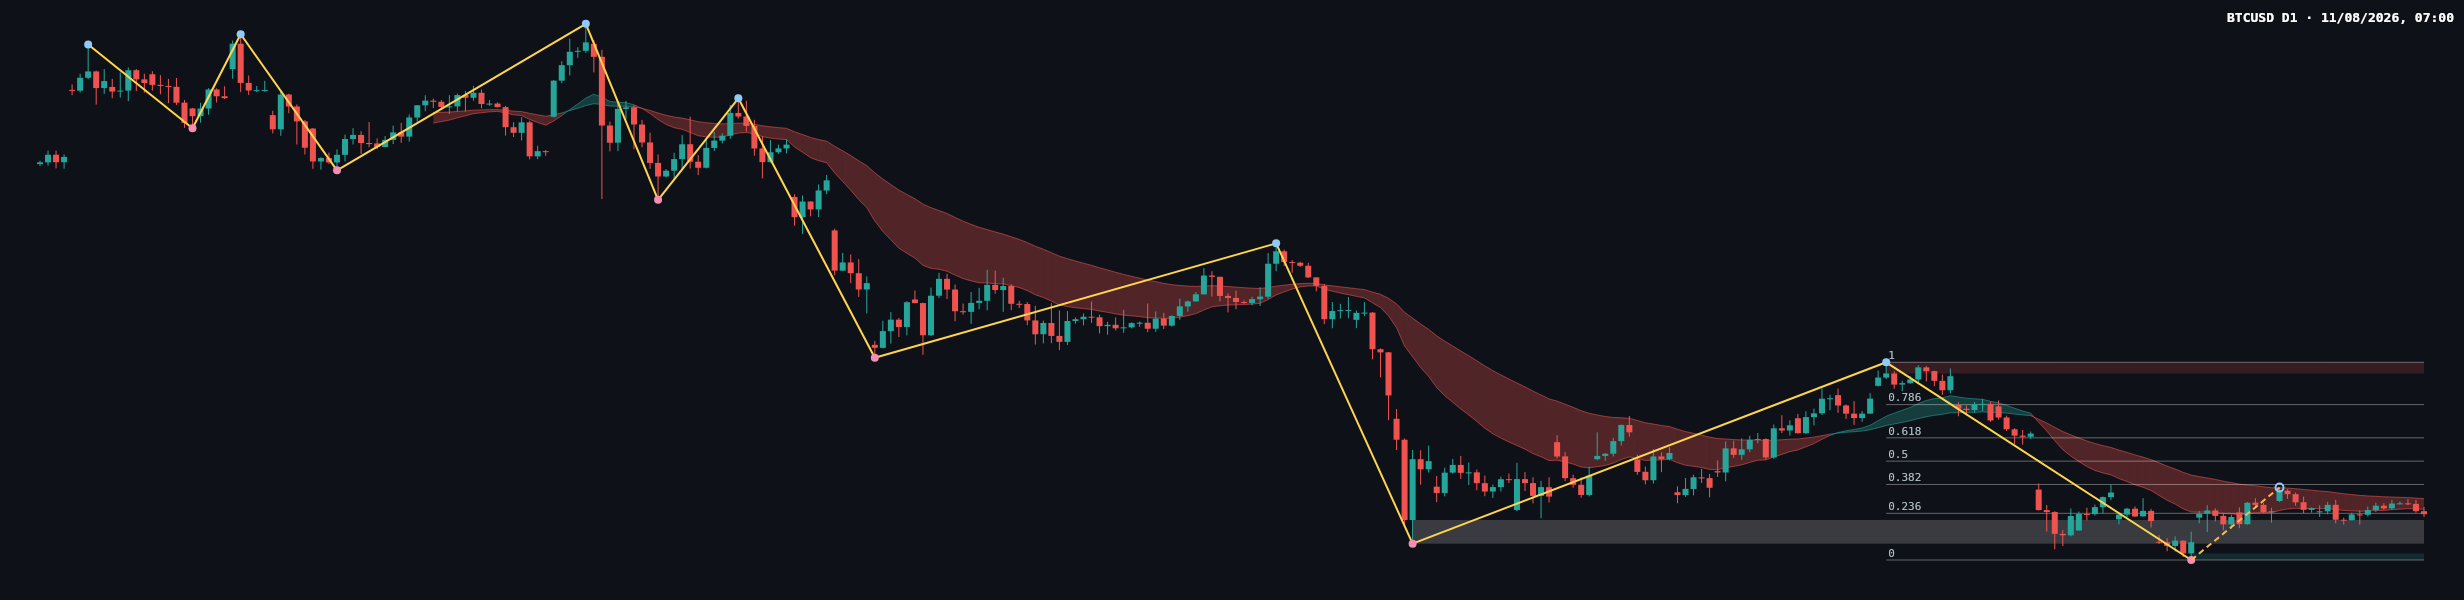
The most recent confirmed daily swing is a low at 57704.79. The principal daily support zone is 57704.79–58541.32. Price is currently above the daily broken-retest zone at 59783.75–62793.85, which now becomes an important test of whether former resistance can function as support. Daily resistance is at 81426.29–82844.58. Daily ATR is 1555.79, indicating that short-term fluctuations can be meaningful even while price remains inside a broader range.
The latest completed Fibonacci leg runs from 57704.79 to 82844.58. The current retracement ratio is 0.232, close to the 0.236 level at 63637.78. The next reference levels are 0.382 at 67308.19, 0.5 at 70274.69, 0.618 at 73241.18, and 0.786 at 77464.66. The market is therefore testing the shallow retracement area rather than a deep recovery level.
Recent price action and closing candle
The latest candles show consolidation after the advance from the lower support area. The most recent sequence contains relatively compact bodies and alternating candle colors, suggesting a balance between buyers defending the reclaimed zone and sellers appearing near the shallow Fibonacci reference at 63637.78. The chart does not provide deterministic candle classifications or numerical open, high, and low data, so a precise label such as a pin bar or engulfing candle is not determinable from the report.
The close at 63534.55 is just below the Fibonacci level at 63637.78 and remains above the broken-retest zone at 59783.75–62793.85. That positioning makes the candle a decision point rather than a confirmed continuation signal. Buyers retain the advantage while the reclaimed zone holds, but sellers would regain control if price returns below it and acceptance develops beneath the zone.
Key levels
- 63534.55: latest closed price.
- 63637.78: Fibonacci 0.236 reference currently being tested.
- 59783.75–62793.85: daily broken-retest zone and immediate structural reference below price.
- 57704.79–58541.32: main daily support zone.
- 67308.19, 70274.69, 73241.18, 77464.66: successive Fibonacci references above the current retracement area.
- 81426.29–82844.58: major daily resistance zone.
- 59783.75–69241.82: broader weekly support zone.
Conditional scenarios
Bullish recovery scenario
If price establishes itself above 63637.78, the recovery could extend toward 67308.19 and then the higher Fibonacci references at 70274.69 and 73241.18. The scenario would be weakened if price falls back through 59783.75–62793.85, because that would question the validity of the reclaimed daily zone. This is the more constructive scenario while the weekly support at 59783.75–69241.82 remains intact.
Range and rejection scenario
If price remains below 63637.78 but continues to hold 59783.75–62793.85, consolidation between the shallow Fibonacci reference and the broken-retest zone would remain the central interpretation. A move back above 63637.78 would challenge the range structure, while a decisive loss of 59783.75–62793.85 would invalidate the holding pattern.
Bearish continuation scenario
If price breaks below 59783.75–62793.85 and cannot reclaim the zone, selling pressure could revisit the daily support at 57704.79–58541.32. A sustained break of that support would invalidate the immediate recovery thesis and place greater emphasis on the firm daily downtrend. The broader bearish scenario would be challenged if price recovers above 63637.78 and then begins accepting higher Fibonacci levels.
Overall, the daily bias is cautious: the weekly framework permits recovery, but the daily trend still favors sellers until price can hold above 63637.78 and progress through the higher Fibonacci references. The cleanest evidence would come from acceptance above the shallow retracement level or a confirmed rejection beneath the broken-retest zone.
Summary
- Weekly conditions are sideways with an upward sub-trend, while the daily trend remains firmly down.
- 63637.78, the Fibonacci 0.236 level, is the immediate upside decision point.
- 59783.75–62793.85 is the key daily broken-retest zone beneath current price.
- A hold above that zone supports a recovery toward 67308.19 and higher Fibonacci references.
- A loss of the zone exposes 57704.79–58541.32 as the next major daily support.
The single most important thing today is whether BTCUSD can sustain acceptance above 63637.78 without losing 59783.75–62793.85.
#BTCUSD #Bitcoin #PriceAction #TechnicalAnalysis #CryptoMarkets
Meta description: BTCUSD remains in a daily downtrend near key Fibonacci and broken-retest zones, with recovery and bearish continuation scenarios in focus.
This article is technical analysis and reference information only, not investment advice. Markets carry risk, and readers are responsible for their own decisions.